Cam Profile Graph
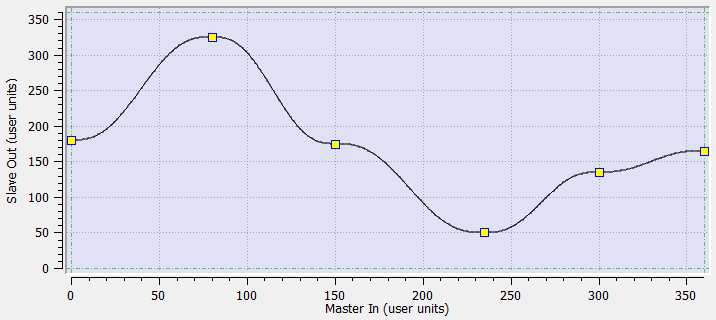
Figure 6-16: Cam Profile Graph
Points and endpoints of lines are displayed as yellow squares (  ) in the graph. The profile offset and amplitude specified in the cam profile editor (see "Create Cam Profiles") are displayed with a green dashed rectangle. The yellow squares are always contained within the green dashed rectangle (although calculated points can extend outside it).
Modifying an Element
You can modify the profile by moving point with the mouse as follows:
- Move the mouse over a yellow square (the cursor becomes
 indicating that the point can be selected)
 - Click to select the point and hold down the mouse button (left-click). When you move the mouse, the point follows the cursor (note that graphical curves and In/Out values are dynamically updated)
In addition, when a point is selected, a slope line is drawn over the point. This line is dashed purple with two additional grips (  ) attached to it. The slope line can be used to change the velocity of the selected point.
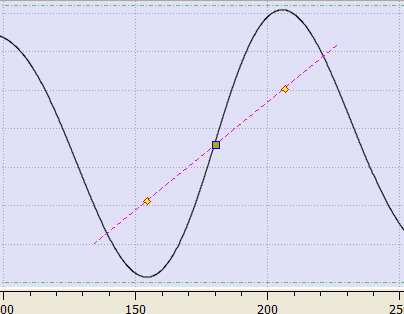
Figure 6-17: Cam Profile Graph - Slope Line
You can change the velocity of the selected point as follows:
- Move the mouse over a slope grip ( ). The cursor changes to an open hand

- Click to select the grip and hold down the mouse. The cursor changes to a closed hand

- When you move the mouse, the slope line follows the cursor, rotating about the selected point and causing the velocity of the selected point to change. (Note that graphical curves and Vel value are dynamically updated)
Cam Profile Graph Contextual Menu
A right-click on the cam profile graph displays a contextual menu.
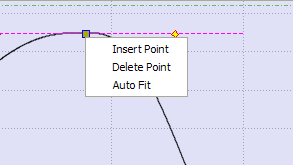
Figure 6-18: Cam Profile Graph - Contextual Menu
|
Command |
Description |
|
Insert Point |
Inserts a new point at the X-Y location of the cursor |
|
Delete Point |
Deletes the highlighted point If the mouse is not near enough to a point, no point is highlighted and this command remains grayed-out |
|
Auto Fit |
Adjusts the zoom and pan settings so that the entire graph is displayed in the graphical area |
Zoom In and Out
In the cam profile graph, you can zoom in or out as follows:
- Move the cursor in the graphical area
- Turn the mouse wheel forward or backward
The current cursor becomes the center point of the zoom function and the area under the cursor remains stationary on the graph.
Panning
In the cam profile graph, you can also pan (or move) in any direction as follows:
- Click on any part of the graph (but not on a yellow square) and hold down the mouse button (left-click)
- Move the mouse to move the graph accordingly
Restoring Zoom and Pan
To restore the zoom and pan settings, so the entire curve is displayed in the graphical area, click on the Auto Fit button  or select the Auto Fit command in the cam profile graph menu.


