Diagnostics tab
This page has information about:
- Errors and Alarms sub-tab
- Hardware Status sub-tab
- Crash Reports sub-tab
- EtherCAT Network Topology sub-tab
Errors and Alarms sub-tab
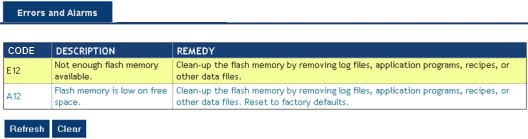
The Errors and Alarms sub-tab and the 7-segment display shows controller errors or alarms generated by the system.
![]()
Figure 1: Diagnostics tab - Errors and Alarms sub-tab
- The Refresh button updates the list.
- The Clear button removes the contents of this tab.
-
- A common error or alarm is because the flash memory is full.
This is often caused by heavy use of the PLC Advanced File function blocks.
Some errors or alarms are only cleared by powering off and restarting the Kollmorgen controller.
See Controller Error and Alarm Descriptions for a complete list of codes.
-
-
Axis errors are on the KAS Application Axis tab.
Hardware Status sub-tab
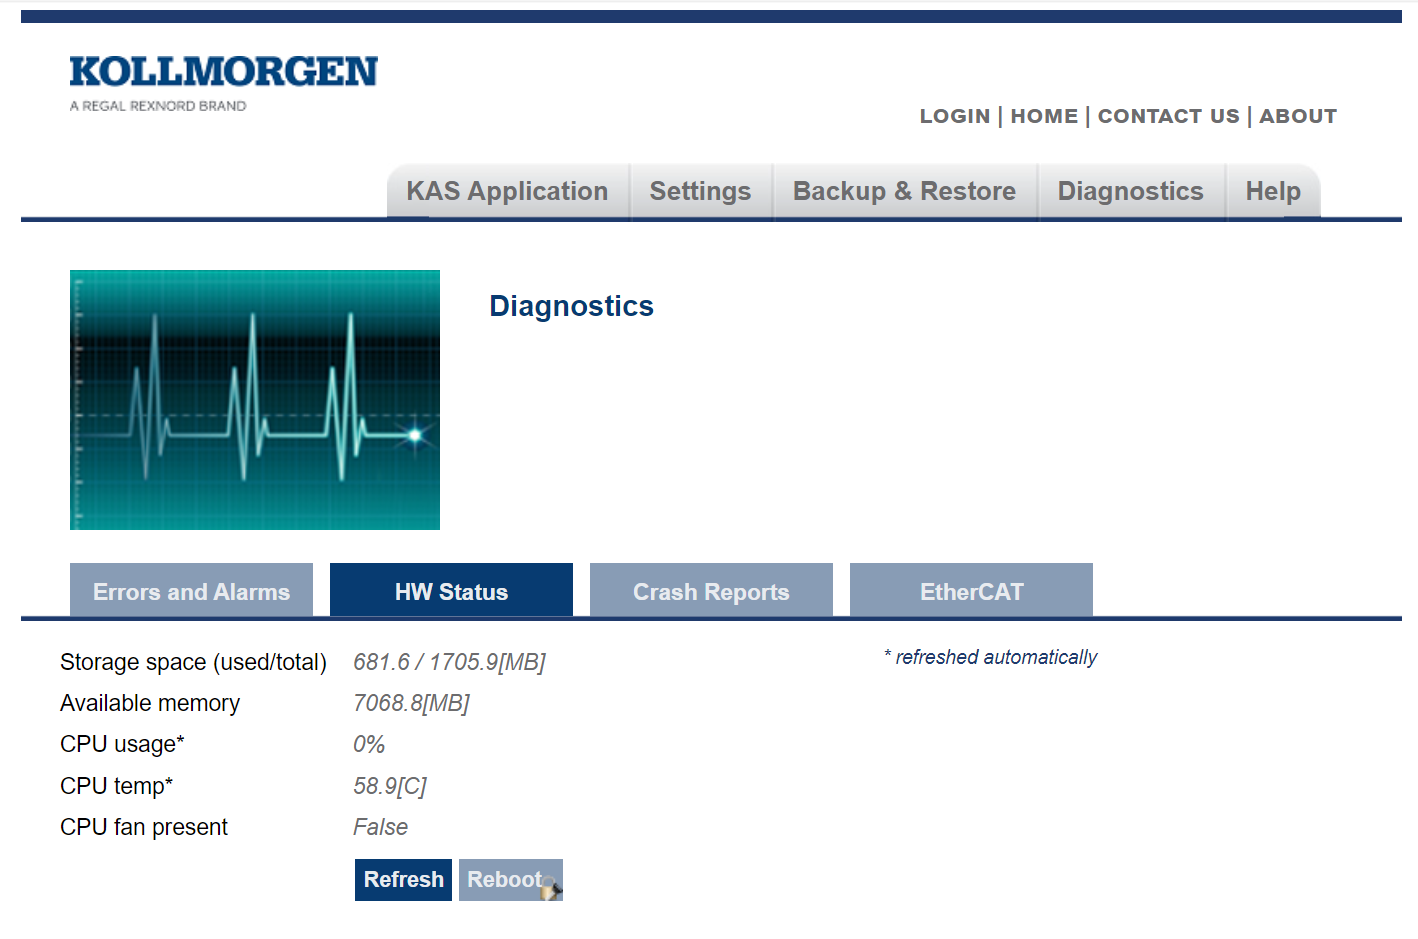
Figure 2: Diagnostics tab - HW Status sub-tab
|
Controller |
Description |
|---|---|
|
Storage Space |
This is both the used and total available amount of storage space in megabytes (MB).
|
|
Available Memory |
This is the amount of RAM memory available on the Controller. |
|
CPU Usage |
This is the current load on the CPU.
|
|
CPU Temp |
This is the temperature of the CPU in Celsius.
|
|
CPU Fan Present |
This is either True or False, depending if there is a CPU fan present in the controller. |
|
Refresh |
Click this button to refresh the Hardware Status information. |
|
Reboot |
Click this button to reboot the web server.
|
Crash Reports sub-tab
The files shown on the Crash Reports sub-tab are reports of the process that failed if there is a crash.
-
- These archives can be sent to Kollmorgen for analysis:
.ZIP for PCMM2G
|
|

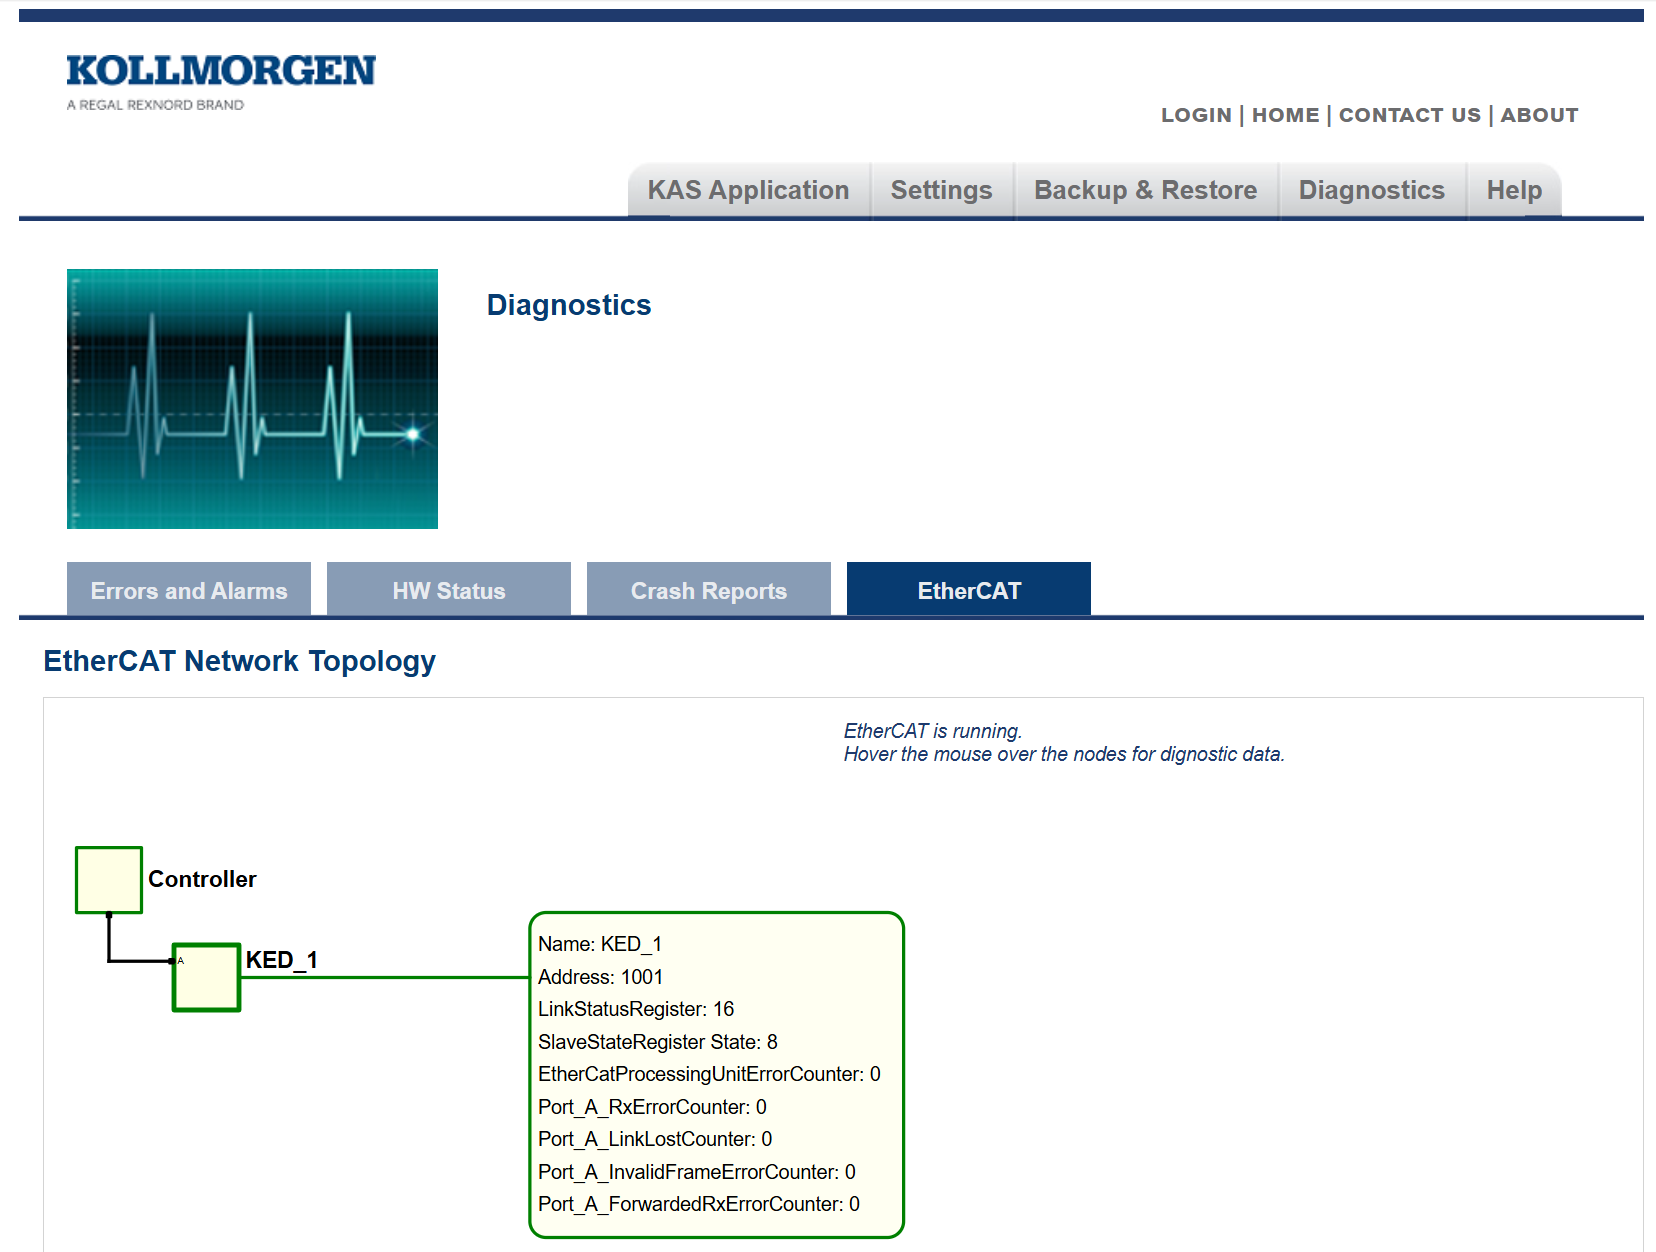
EtherCAT Network Topology sub-tab
This sub-tab shows the EtherCAT network topology and the data for each node in the network.
![]()
Figure 4: Diagnostics tab - EtherCAT sub-tab without data