Controller Performance
Kollmorgen offers several controllers with varying performance. This topic compares the relative performance to help make a decision about what is best for your needs.
This topic has these sections:
Examples: Performance Graphs
These graphs are for guidance in initial controller selection for development.
Notes
- During development, the performance of an application should be measured to ensure that the selected controller meets the performance requirements.
- Measurements can be done with either the:
- KAS's digital oscilloscope using the trace times traces.
- GetCtrlPerf function block.
- Observation of the CPU usage on the Diagnostics tab tab of the KAS controller's web page interface.
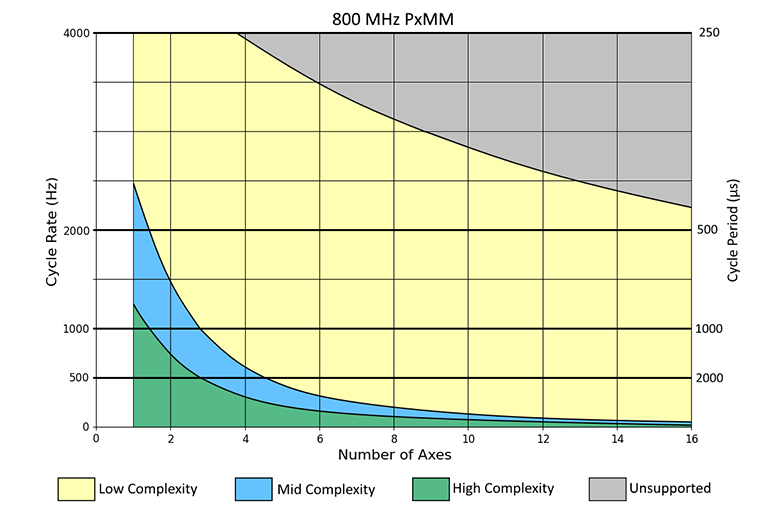
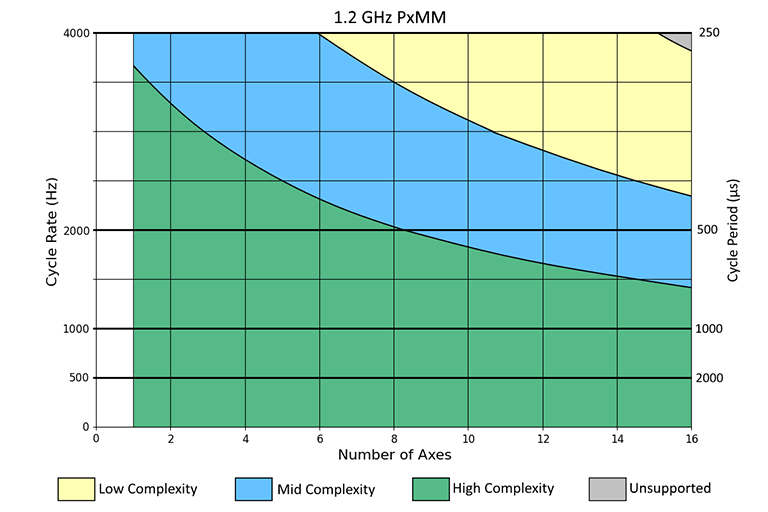
Single Core
|
Figure 1: 800MHz Single-core |
Figure 2: 1.2GHz Single-core |
Dual Core
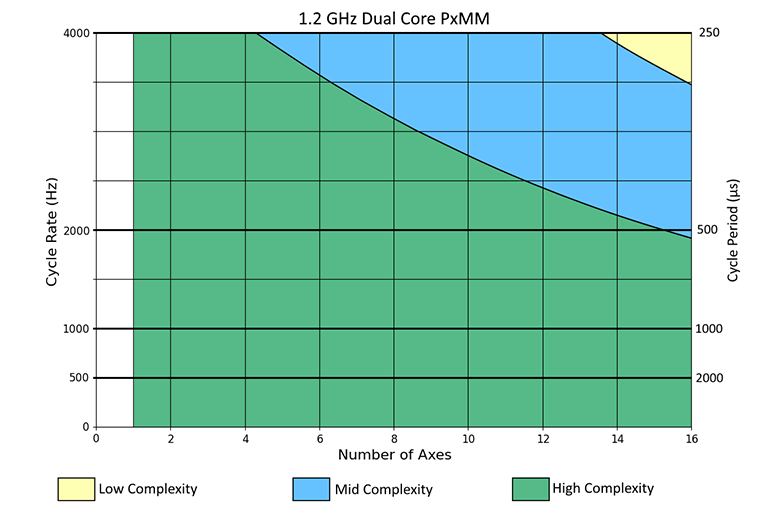
Figure 3: 1.2GHz Dual-core
PCMM2G Controllers
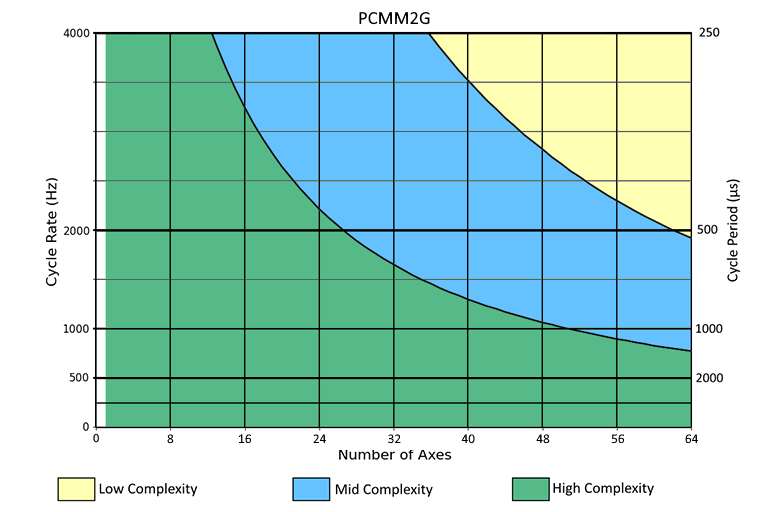
Figure 4: PCMM2G Controllers
Application Complexities
High Complexity
A high-complexity application is characterized by:
- Complex setups.
- Most axes being slave axes.
- Cammed or geared to a master axis.
- Frequent moves.
- Frequent reading and setting of external I/O points, and complex PLC logic.
A 4-axis high-complexity application running at 1kHz (1000us) can be handled by a single-core 1.2 GHz PxMM.
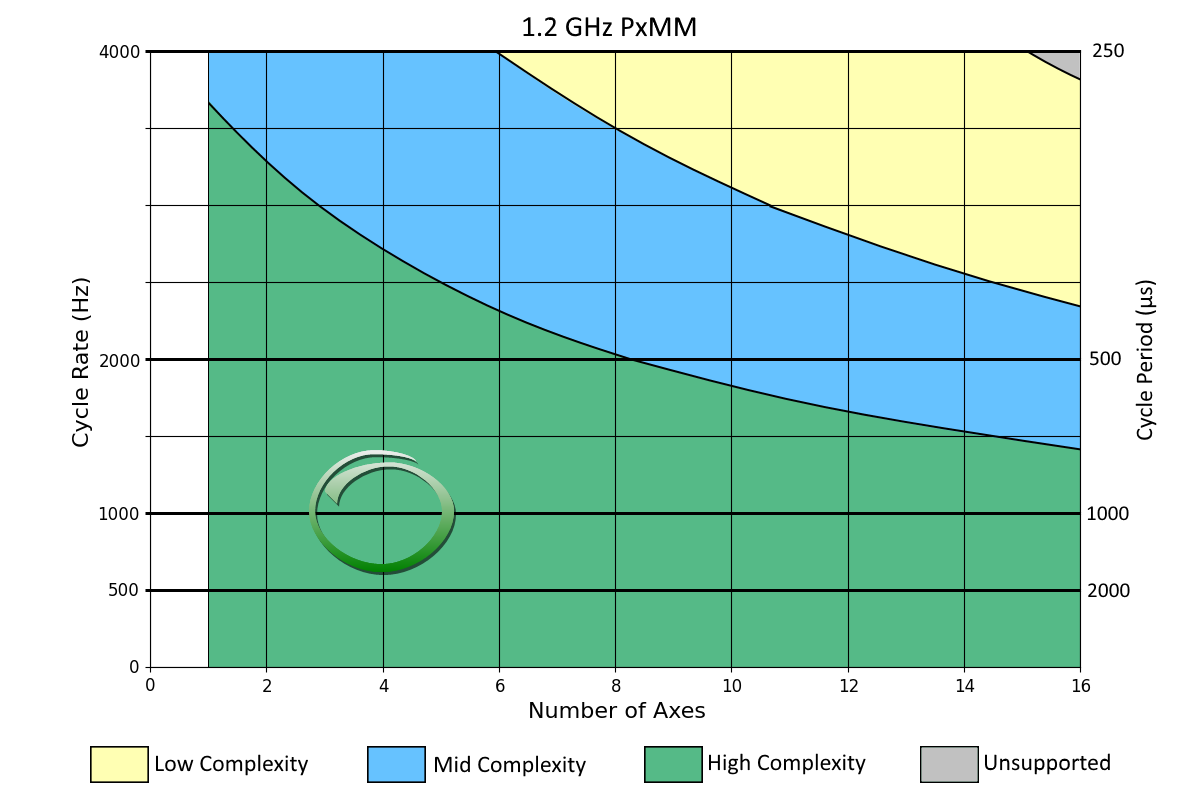
Figure 5: Example: High Complexity
Middle Complexity
A middle-complexity application is characterized by:
- Being in between High and Low Complexity.
- Most axes are point-to-point or velocity moves.
- Some axes are cammed or geared to a master.
- PLC logic is split so parts of a complex logic run at given times.
A 12-axis middle-complexity application running at 4kHz (250us) requires the dual-core 1.2 GHz PxMM.
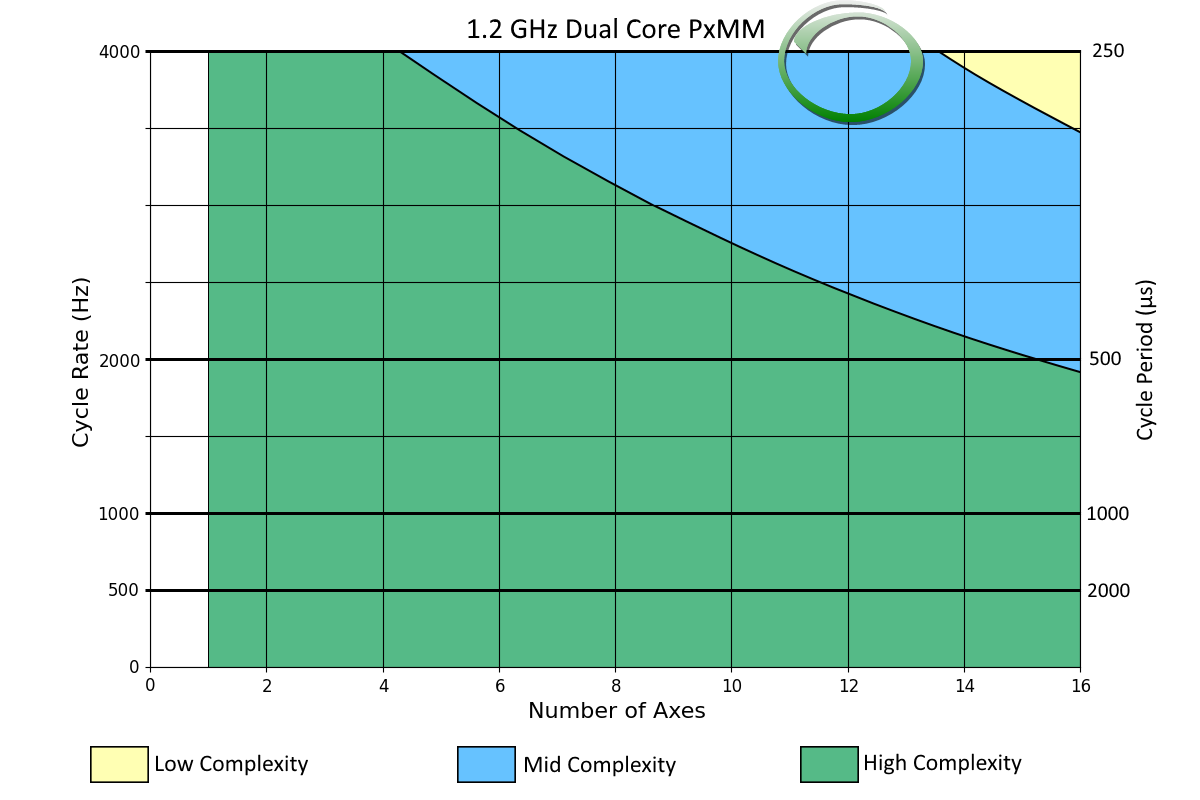
Figure 6: Example: Middle Complexity
Low Complexity
A low-complexity application is characterized by:
- Point-to-point and velocity moves.
- Occasional reading of external I/O points, and simple PLC logic.
A 10-axis low-complexity application running at 2kHz (500us) can be handled by an 800 MHz PxMM.
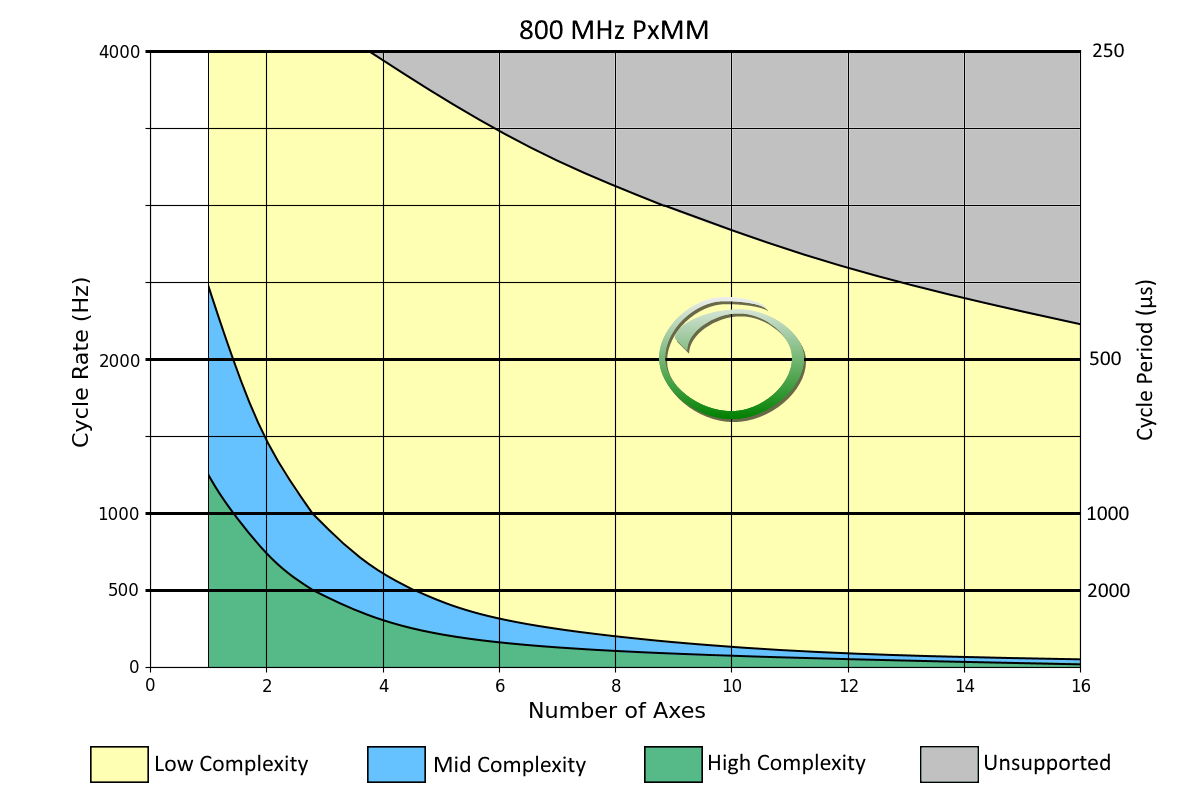
Figure 7: Example: Low Complexity
Pipe Network and PLCopen Applications
Pipe Network applications usually use less of the controller's CPU.
When using the graphs:
- A Pipe Network application acts like a slightly Low Complexity application.
- A PLCopen application acts like a slightly High Complexity application.
Performance FAQs
To determine which controller model to use for initial development of an application, the axis count and cycle rate of the application can be used to determine what type of application can be run on different controllers.
Example
You are planning a middle-performance application for 6 axes that runs at a 2kHz (500us) cycle rate.
Use these requirements:
- The single-core 1.2GHz PxMM can handle a High Complexity application.
- The 800MHz PxMM can only handle a Low Complexity application.
- Solution: Since only a Middle Complexity application is needed, the single-core 1.2GHz PxMM should be sufficient for this application.
-
- If in doubt, start with a higher-performance controller model and, after optimizing the application code, determine if a lower-performance model will meet the present and future needs for the application.
The dual-core PxMM improves performance by running PLC code and motion code at the same time.
- Typical performance gain varies from 45% to 80%, depending on the type of application being run.
- The greatest performance gain is obtained when PLC code execution time and motion code execution time, measurable using the trace times feature, are roughly the same.
- If one of these two values dominate the execution time, the performance gain is on the smaller side.
- See Practical Application: Using Trace Time To Measure CPU Load.
The PCMM2G improves performance by running PLC code and motion code at the same time.
- Typical performance gain varies from 130% to 300%, depending on the type of application being run.
- This is 2.3 to 4 times the performance of the 1.2GHz PxMM.
- The greatest performance gain is obtained when PLC code execution time and motion code execution time, measurable using the trace times feature, are roughly the same.
- If one of these two values dominate the execution time, the performance gain is on the smaller side.
- See Practical Application: Using Trace Time To Measure CPU Load.
If using these controllers with the designated peak CPU usage, downgrade to the identified controller.
|
Active Controller |
Peak CPU Usage |
Downgrade to this Controller |
|---|---|---|
|
PCMM2G |
Under 35% |
Dual-core PxMM |
|
PCMM2G |
Under 25% |
Single-core 1.2GHz PxMM |
|
Dual-core PxMM |
Under 40% |
Single-core 1.2GHz PxMM |
|
Dual-core PxMM |
Under 25% |
800MHz PxMM |
|
Single-core PxMM |
Under 50% |
800MHz PxMM |
See Diagnostics tab.