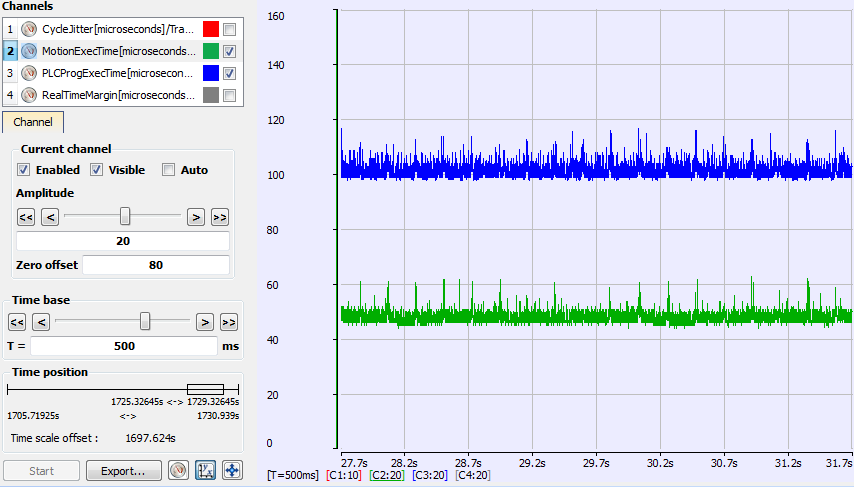
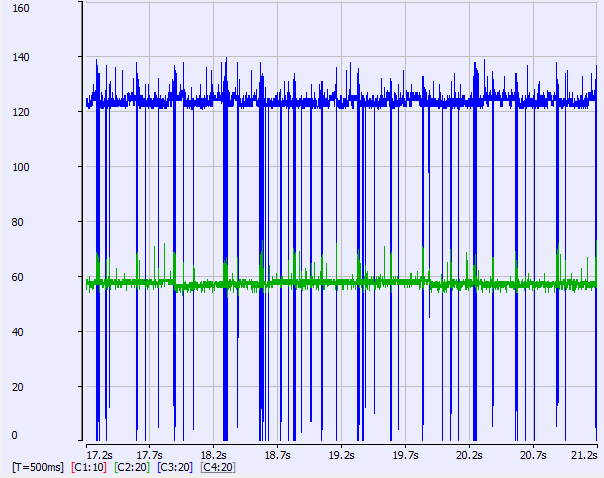
Here is an example of an application that is heavily loading a PDMM or PCMM with the EtherCATEtherCAT is an open, high-performance Ethernet-based fieldbus system. The development goal of EtherCAT was to apply Ethernet to automation applications which require short data update times (also called cycle times) with low communication jitter (for synchronization purposes) and low hardware costs Cycle Time = 250 microseconds. Using the techniques described in Practical Application: Using Trace Time To Measure CPU Load, examine the "MotionExec" and "PLCProgExec" times first:
The average MotionExec + PLCProgExec = 50 + 105 = 155 microseconds. This is about 62% (155 / 250) of the cycle time.
Take a look at the peaks:
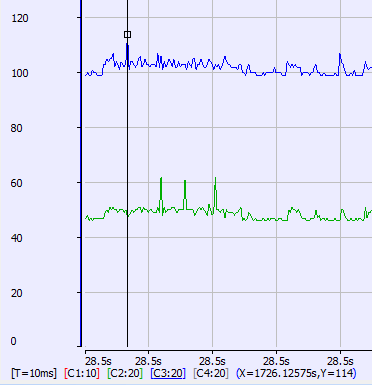
This shows the MotionExec at 62 microsec and the PLCProgExec at 114; there is not much time left over.
Notice the minimum time is 20 microseconds or 8% Real-Time margin (20 / 250). This is not a comfortable margin for deterministic Real-Time performance.
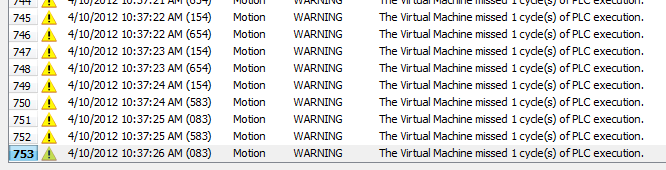
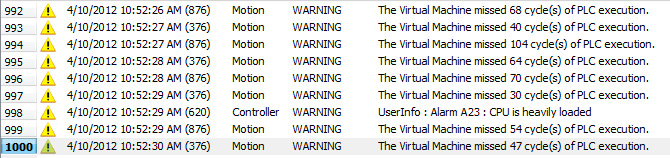
Checking the Controller log we see that the Virtual MachineThe complete assembly of all connected parts or devices, of which at least one is movable (PLCProgExec) is missing a cycle occasionally:
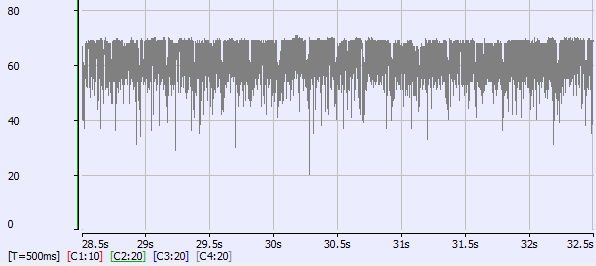
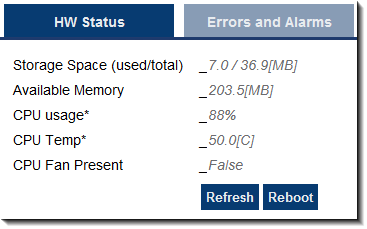
Lastly, take a look at the overall CPU load. At 88% usage there’s not much CPU bandwidthIn computer networking, bandwidth often refers to a data rate measured in bits/s, for example, network throughput. The reason for the connection of data rate with the term bandwidth is that the limit to the data rate of a physical communication link is related to its bandwidth in hertz available.
Now, let’s take a look at an example of an application that is overloading a PDMM or PCMM with the EtherCAT Cycle Time = 250 microseconds. Using the techniques described above, examine the "MotionExec" and "PLCProgExec" times first:
The average MotionExec and PLCProgExec times are 57 + 125 = 182 or 73% (182 / 250) of the Cycle Time. Notice the big spikes on the PLCProgExec?
Next, look at the "RealTimeMargin":
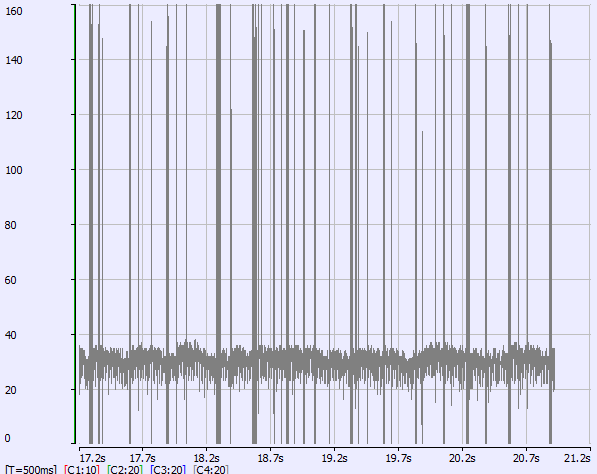
There are many cycles with zero real-time margin. Notice the big spikes? This is a degraded case.
The Controller log confirms the missing VM cycles and an A23 alarm:
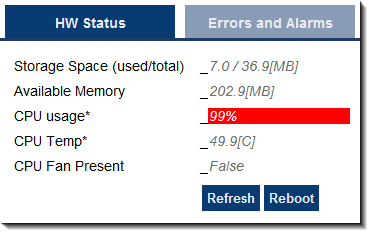
Lastly, the overall CPU load is 99%. Clearly this application is overloading the CPU:
|
Stay Connected with Kollmorgen       
|
Copyright © 2015 Kollmorgen™ |

|