The Performance Servo Tuner (PST) tunes your system quickly and easily. The advanced technology in the PST achieves high performance and stability for both simple and complicated loads. It also collects frequency response data (bode plot) that can be used for advanced analysis. The PST can work in a “one button” mode that requires no customization. Settings can be also changed for an array of system requirements (Using the Performance Servo Tuner: Advanced).
The PST will not work reliably on a vertical axis, since the motor may rest against an end stop. In this case, the inertia will not always be correctly identified.
The default PST settings tune systems quickly for good servo performance. If your tuning is not acceptable after running PST, try adjusting the following settings.
Look through the advanced tuning section for more information. Complex systems may require more adjustment.
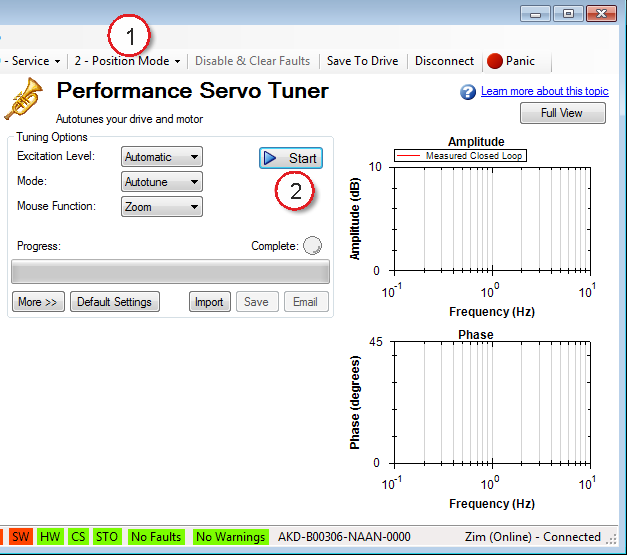
The PST defaults to a “one button” mode, in which the PST is completely automatic after pushing the start button. In the Settings select your desired operation mode,navigate to the Performance Servo Tuner view, and then tune your system as follows:
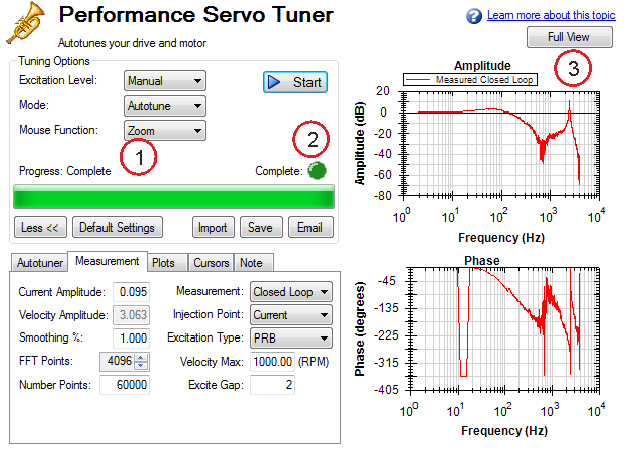
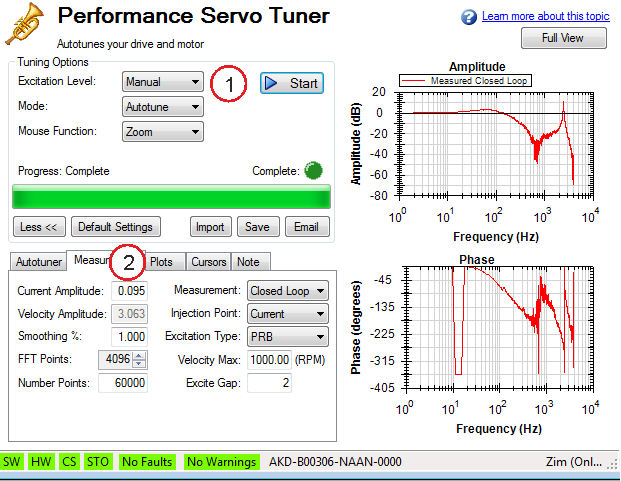
The PST will then perform several tests and display results as shown below. The progress bar (1) shows the relative progress of the PST, so you can estimate when the tuning will be finished. When the tuning is complete, the green Complete LED (2) illuminates, and a Bode plot (3) is displayed showing the frequency response of the tuned system.
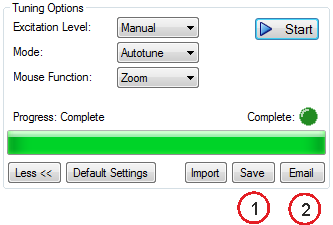
To save screenshots and raw data of a Bode plot, click on either Save (1), or Email (2).
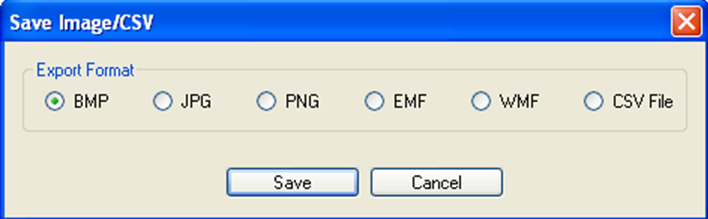
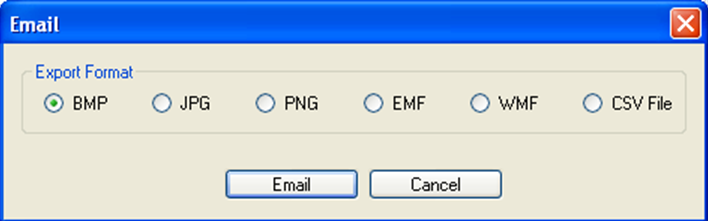
Clicking Save opens a prompt to select how to save the screenshot or data. Selecting BMP, JPG, PNG, EMF, or WMF saves the Bode plot as an image. Choosing CSV saves the raw data that is currently plotted as a comma delimited file. Click Save to save the file to your hard drive in the desired format.
Clicking Email opens a similar prompt. Select the file format in which you wish to save the image or raw data, and an email will be created for you with the file automatically attached for your convenience. Click Email to create the email with the selected file attachment.
If you have previously saved a frequency response measurement into a CSV file, it can be imported for later viewing. Click the Import button, and browse to your saved CSV file. You can import while in offline mode for convenience. Importing a frequency response is useful for off-site developers to analyze a machine tool.
By default, the PST determines the excitation level automatically and autotunes the drive and motor.
The PST also allows you to enter a manual excitation level or to take only Bode measurements (without autotuning the system).
By default, the PST is set to use the automatic excitation level. To obtain the automatic excitation level, the PST runs a friction test at the beginning to determine how much excitation is needed to break friction and get an accurate measurement.
To change this excitation level, click on the Excitation Level drop-down box (1), and select Manual. Then enter a new Current Amplitude (2) in amps.
Note: If the Injection Point is set to Current, then the Current Amplitude box will be enabled to enter an excitation level; if the Injection Point is set to Velocity, the Velocity Amplitude box will be enabled to enter an excitation level.
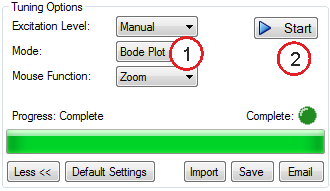
You may wish to take only the frequency response of a system, rather than using the PST. To take a frequency response measurement without the PST, click on the Mode drop-down box (1) and select Bode Plot, then click Start (2).
|
Stay Connected with Kollmorgen       
|
Copyright © 2015 Kollmorgen™ |

|