The Graphical Area

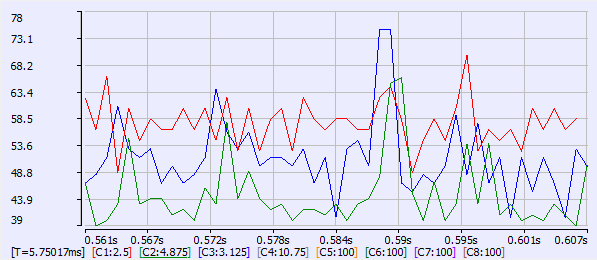
Figure 7-31: Example of the traces generated in the Oscilloscope.
To better view and analyze the data, the graph has the following features:
- Graduations are displayed on the left and lower sides of the graph
- Information concerning the time-frame of the graph and the amplitude of channels also appears at the bottom of the graph. The current channel amplitude is underlined and the coordinates of the nearest collected sample are displayed
- It is possible to zoom in the graph using various methods (for more details, see Trace Zoom Feature)
- It is possible to move the contents of the graph within the time-base (for more details, Trace Zoom Feature)
-
-
Moving the contents is possible only when the acquisition is stopped.
See How Do I Export the Oscilloscope Data? for information on capturing the trace data.


