Log Data
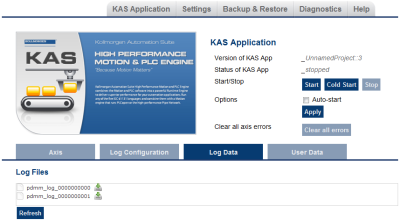
KAS log files may be viewed from the Log Data tab. These messages can help describe the current state of the system and to help identify any operation errors encountered when developing your system. A AKD PDMM or PCMM will display as many as 10 files.
Figure 6-2: Example of log files displayed from a AKD PDMM or PCMM webserver.
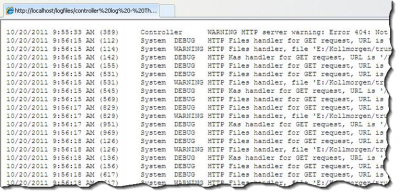
Clicking on a listed log file will open it in your web browser. The log file may be downloaded by clicking on the green download icon next to the log entry. The default name is the same as the file's name. If you try to open a file that no longer exists, the message "/logfiles/<selected file name> not found." Refresh your browser window and try again.
Figure 6-3: Example of a log file's content, displayed in a browser.
-
-
Log data is collected and updated every 15 seconds on a AKD PDMM or PCMM. A new log file will be created when the current file is full. You may need to wait for up to 15 seconds for a log to show up in the list. The AKD PDMM and PCMM log files both have the same file naming scheme (pdmm_log_xxxxxxxxxx).
Log Message Content
Every log message in the table has the following information:
|
Field |
Description |
|
Time |
Time when the log was recorded with the format: |
|
Identifies a software or hardware component issuing the messages. Each source is configured with a specific Level. |
|
|
Each message has one of the following levels with importance in ascending order: |
|
|
Message |
Text of the message issued from the source |


