The Control Panel
|
|
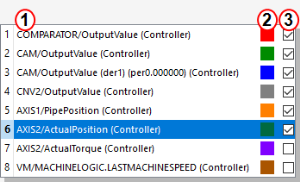
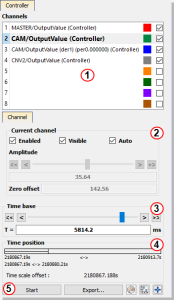
This lists the eight available channels and the variables assigned to each.
Figure 6-33: Scope Control Panel - Channels
For each channel, it displays:
- The name of the associated variable
 .
. - The color of the associated trace in the graph with a color icon
 .
. - The visibility of the associated curve with a check box
 .
. - This is to quickly show/hide each captured trace.
-
-
You can change the color of a curve by double-clicking on its color icon, and its visibility by clicking on its check box.
-
-
Right-click on a channel to map, unmap, or edit the color of a variable's trace.
When selecting a channel in the channels list, it is superimposed on the existing traces, and some related information are displayed on the left and lower sides of the graph.
This section details the properties of the currently selected channel. 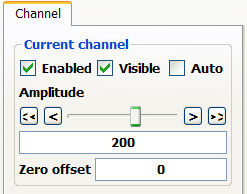
| Properties | Description |
|---|---|
| Enabled |
A channel has to be enabled to acquire the samples sent by its associated probe. |
| Visible |
A channel has to be visible to be drawn on the graph. Even if not visible, it continues to acquire the samples sent by its associated probe. |
| Auto |
A channel in auto mode automatically adapts its amplitude (unit/division) and zero offset to display all its samples.
|
| Amplitude |
Controls the amplitude
|
| Zero offset |
The curve is vertically shifted so that this value is located halfway through the graph height. |
-
-
On some special devices, some more tabs that are specific to extra configurations appear in this widget. For example, S300
 "Servostar 300 drive"
See Servo Drive in Glossary device provides trigger functionality, so an additional tab is displayed for the trigger configuration.
This enables you to set the speed at which all the lines for each channel are drawn, and is calibrated in milliseconds per division.
- Its usage is similar to the Amplitude property described in the above section.
- The time-base can always be changed, even during sampling (see Time Scale).
Figure 6-34: Scope Control Panel - Time-base
To setup the time-base properly, the total measurement duration and the required time resolution have to be taken in account.
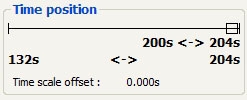
This enables you to change the time-frame of the acquired samples shown on the graph. It is composed of:
- A single horizontal line represents all the acquired samples with start and stop timings.
- A rectangle represents only the time slot of the acquired samples shown in the graphical area (the time-frame) with timings:
Figure 6-35: Scope Control Panel - Time Position
-
-
The acquisition of samples is limited to 100'000 cycles (ie. 100 s when cycle time is set to 1000 µs, and 25 s when cycle time is set to 250 µs). When you reach this limit:
- The first data that are added to the queue are the first data to be removed (FIFO queue)
- The start timing increases
You can change the time slot with the mouse by:
- moving the rectangle

- changing the size

The Time Scale Offset is the time value of the first sample the graph when plotting is started. Using this as an offset, the time axis is always started at 0 seconds. To get the actual time value of any sample, add the time scale offset to the Time axis value.
Actual Sample Time Value = Time Scale Offset + Time axis value
When clicking anywhere on the horizontal line, the time-frame is centered on the clicked point. It is also possible to move the time-frame by clicking on its rectangle part and dragging.
You can resize the time-frame in a user-friendly manner by clicking on its left or right ends and dragging.
-
-
During acquisition the time position item is disabled and displays the progression of acquisition.
At the bottom of the controls are five buttons:
- The Start/Stop button
 is used to start or stop the acquisition of samples.
When starting acquisition, all previous samples are lost. - The Export... button
 is used to save the acquisition data in a CSV file.
See The Graphical Area for more information. - The Plug Trace Times Channels button (
 ) is used to quickly load and display these channels:
 -
Channel 1: Cycle Jitter
 The difference between the configured cycle time and the actual meausured cycle time. Units in microseconds. (in µs)
 See note about Current cycle time
When the motion is started, the current cycle time remains constant on an average of several cycles, and equal to the EtherCAT
 ***EtherCAT is an open, high-performance Ethernet-based fieldbus system. The development goal of EtherCAT was to apply Ethernet to automation applications which require short data update times (also called cycle times) with low communication jitter (for synchronization purposes) and low hardware costs cycle time which is a constant value (1000, 500 or 250 µs).
 The CycleJitter is due to EtherCAT transmissions that can vary in a particular cycle (i.e., call out
 ).
).The channel 1 of the scope monitors the time difference between the expected Cycle Time and the actual Cycle Time. (see figure below).
Figure 6-36: Cycle Time Calculation
-
Channel 2: Motion execution time (microseconds)
-
Channel 3: PLC
 "Programmable Logic Controller"
A Programmable Logic Controller, PLC, or Programmable Controller is a digital computer used for automation of industrial processes, such as control of machinery on factory assembly lines.
Used to synchronize the flow of inputs from (physical) sensors and events with the flow of outputs to actuators and events execution time (microseconds)
"Programmable Logic Controller"
A Programmable Logic Controller, PLC, or Programmable Controller is a digital computer used for automation of industrial processes, such as control of machinery on factory assembly lines.
Used to synchronize the flow of inputs from (physical) sensors and events with the flow of outputs to actuators and events execution time (microseconds)-
Channel 4: Real Time Margin (microseconds)
- This channel monitors the available execution time (
Cycle Time Period x Controller Core Count - EtherCAT network execution time - MotionExecTime). The measured execution time for the Motion Engine (either PipesNetwork or PLCOpen) in each cycle period. Units in microseconds. - PLCProgExecTime
 The measured execution time for the PLC application program (either PipesNetwork or PLCOpen) in each cycle period. Units in microseconds.
 - The measurement is based on CPU usage, which provides the most accurate measurement.
- The measurement is updated each cycle period.

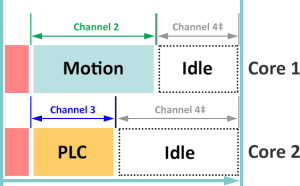
Figure 6-37: Motion, PLC and Real Time Margin Time Calculations
‡ Channel 4 is the total amount of time across all CPU cores.
Figure 6-38: Multiple Core Controller, PLC and Real Time Margin Time Calculations.
- This channel monitors the available execution time (
-
-
-
This feature is not relevant with the KAS Simulator.
The MotionExecTime and PLCProgExecTime traces are visible with simulated values.
The CycleJitter and RealTimeMargin The measured available execution time (equals the Cycle Time Period – EtherCAT network execution time – MotionExecTime – PLCProgExecTime) in each cycle period. Units in microseconds. always remain at zero with the simulator.
 - The graduations button (
 ) displays or removes the axis graduations of the graphical area.
By graduations are visible by default. - The autofit button (
 ) changes the time-frame of the graph and amplitudes and zero offsets of channels so that they all fit entirely into the graphical area.
See Tasking Model / Scheduling for more information.
