Curve Selection and Color Table
- If the element is a line, the velocity is constant and acceleration is 0.
- With the check boxes in the Curve selection table (Figure 1), you can select or clear each individual curve to be displayed.
- When a curve is selected (see blue highlighted row in Figure 1), the Y-scale of the Curves graph is adjusted to display the Y-scale of the selected curve.
- The color of the tick line of the scale is changed to match the color code of the selected curve.
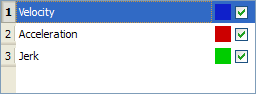
Figure 1: Curve Selection Table
Change the Color
- Double-click on a colored square shown in the Curve Selection Table.
The Select color dialog box opens. (Figure 2) - Click an existing color square to select it, or specify the numerical values for a color.
You can move the black indicator on the right side until the desired color appears in the large colored rectangle.
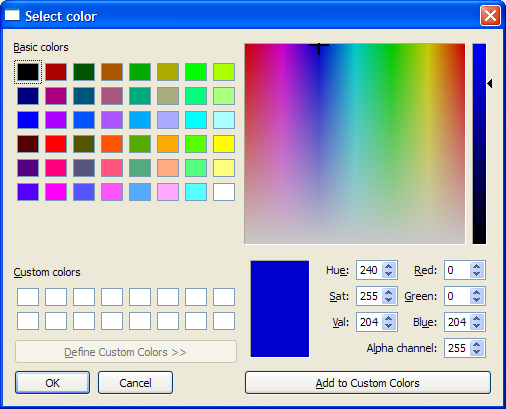
Figure 2: Select color dialog box


