Diagnostic Panels - Home page
Usage
This window is used to:
- View Control Panels designed in the KAS-IDE in a web browser.
- This tab is only available when the Generate Web-based Control Panels check box is selected in the Project Settings dialog box.
- See Web Diagnostic Panels to enable this feature.
Access
- Open a web browser.
- Enter the controller's IP address for the URL.
The Web server Home page opens. - Click the Diagnostic Panels sub-tab on the right of the window.
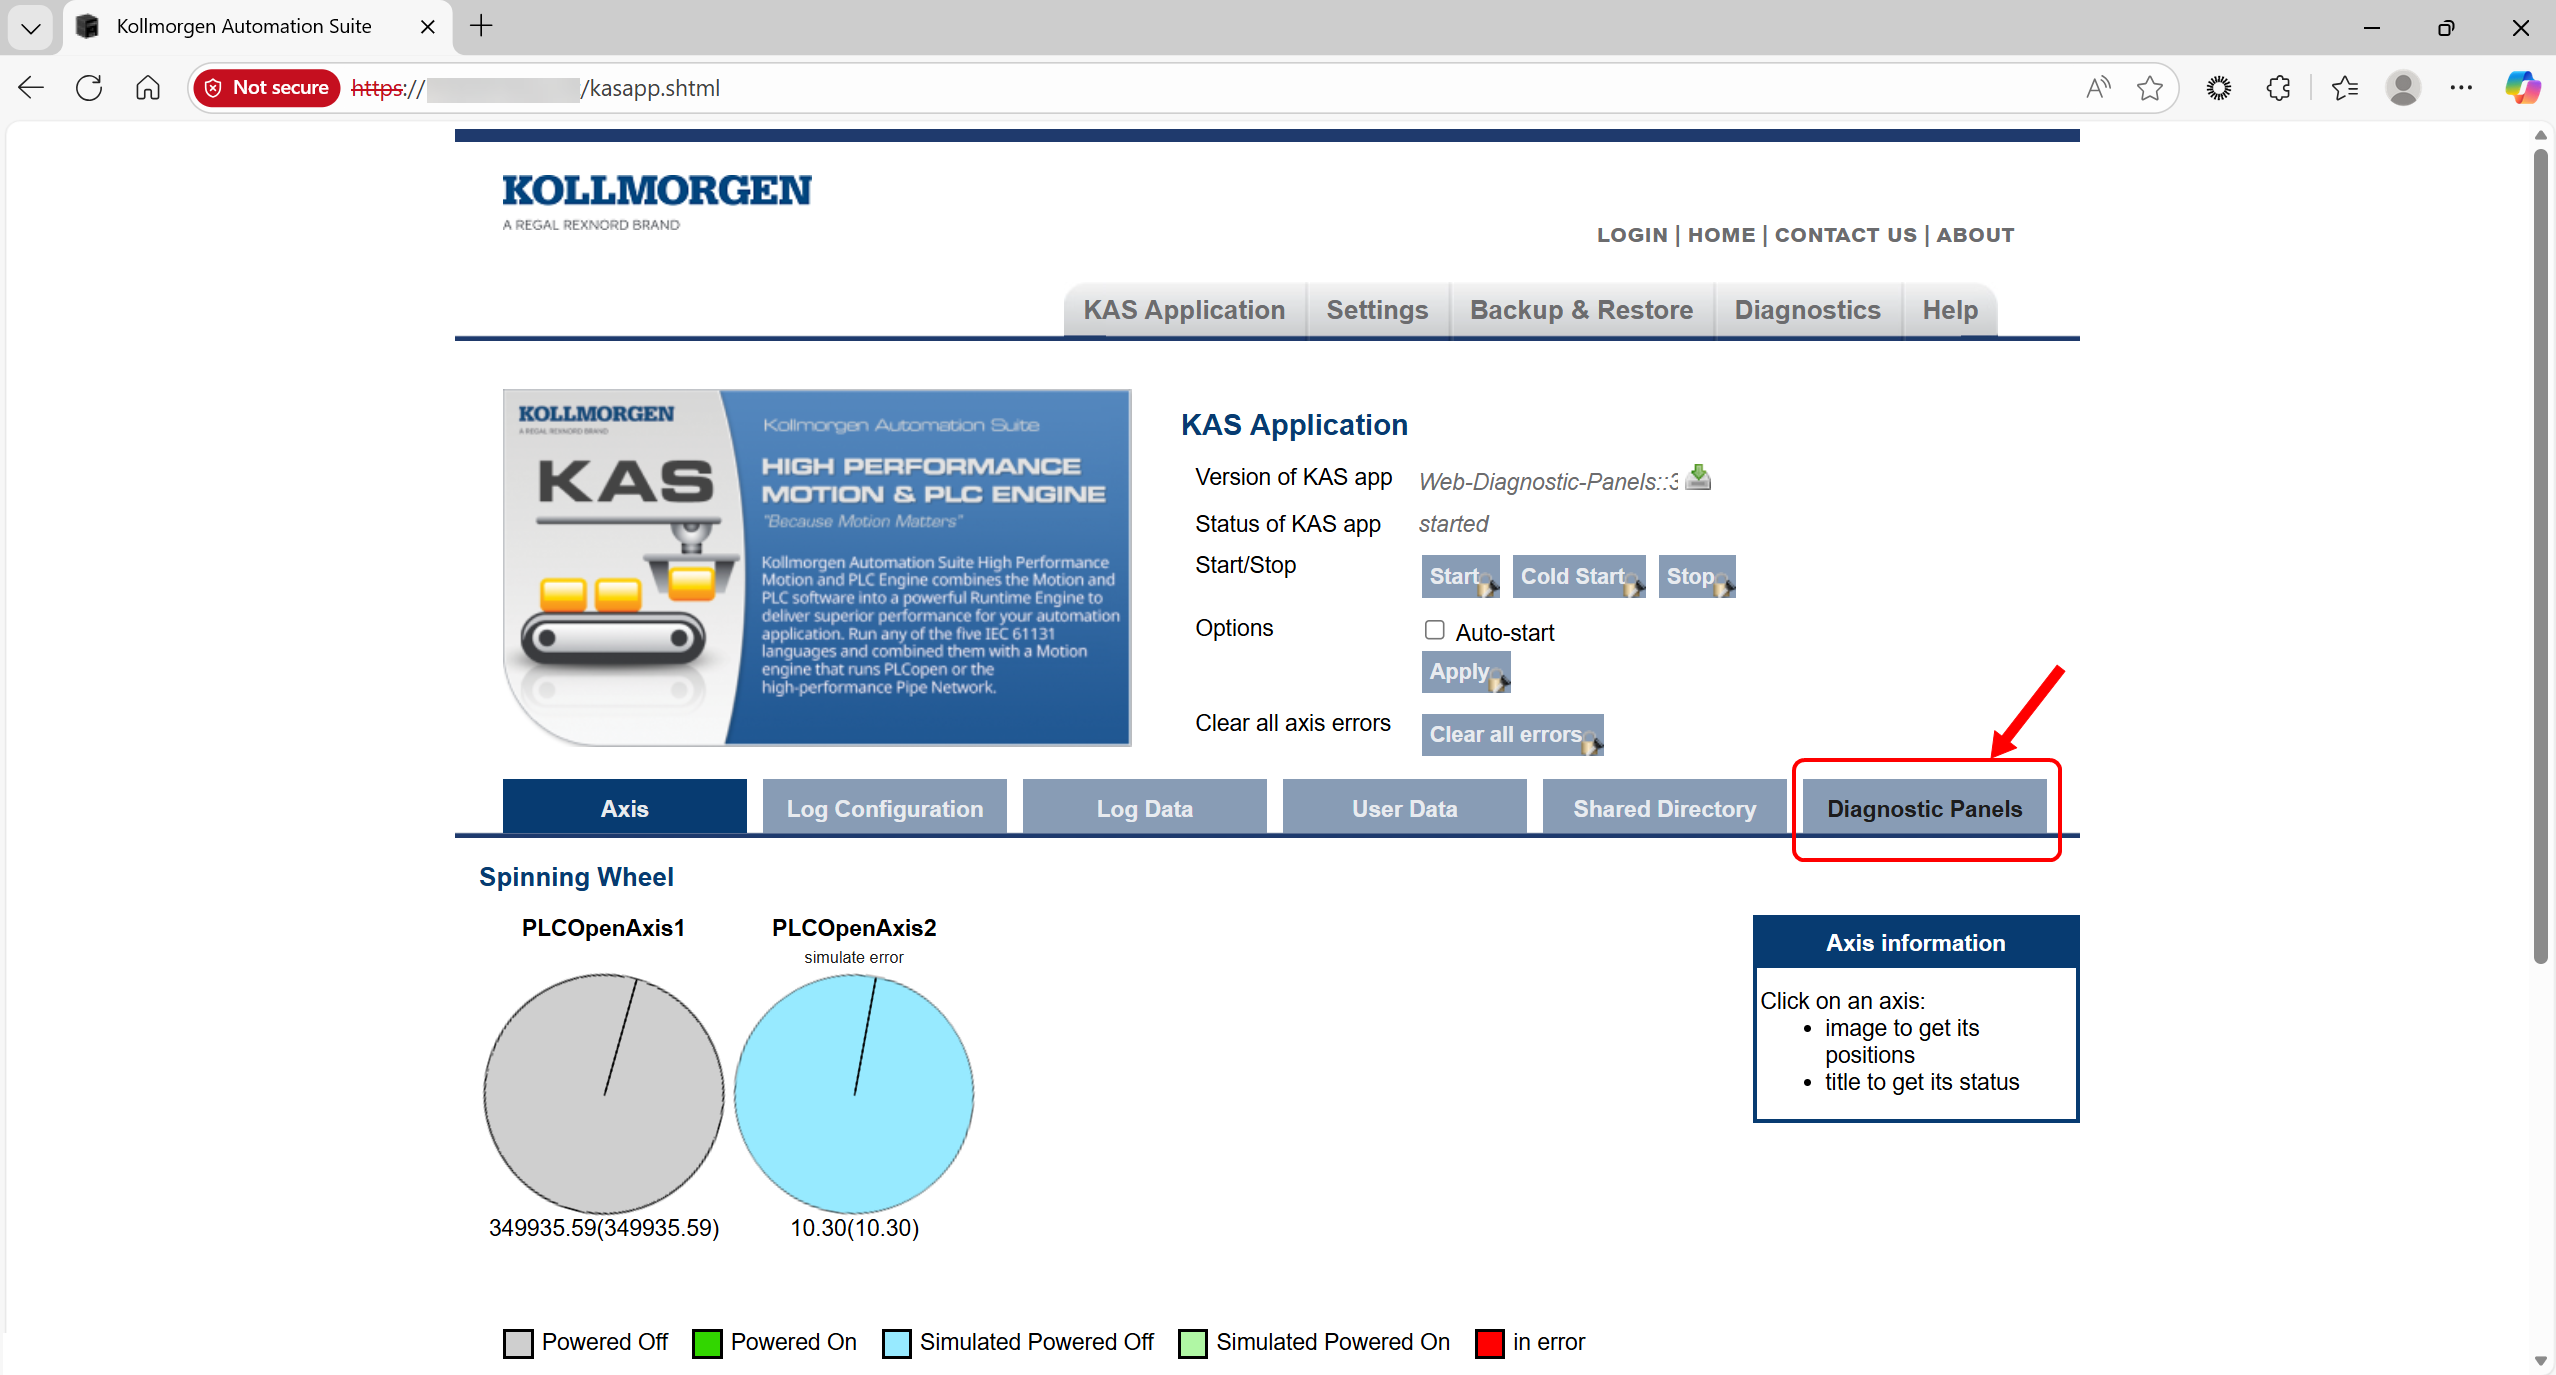
Figure 1: Diagnostic Panels sub-tab
The Diagnostic Panels - Home page opens.
Window Description
-
-
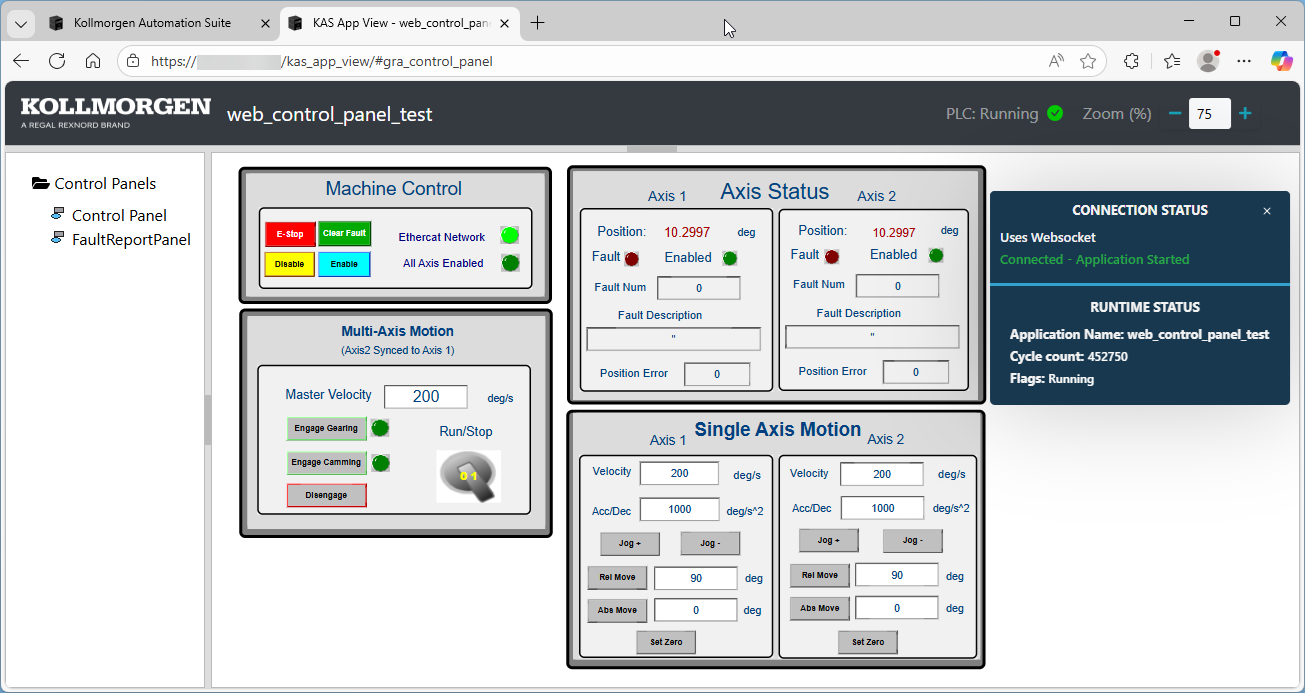
The content of this window depends on the specific application project controls.
The window shows this information:
- Connection status with KAS Runtime.
- Control page zoom setting adjustments.
- A collapsible side bar with links to view all control panels present in the KAS project.
Notes
- After a period of inactivity, the Diagnostic Panel session times out and disconnects from the KAS Web server.
- This is indicated by the message Connection is closed displayed on the top bar. (Figure 1)
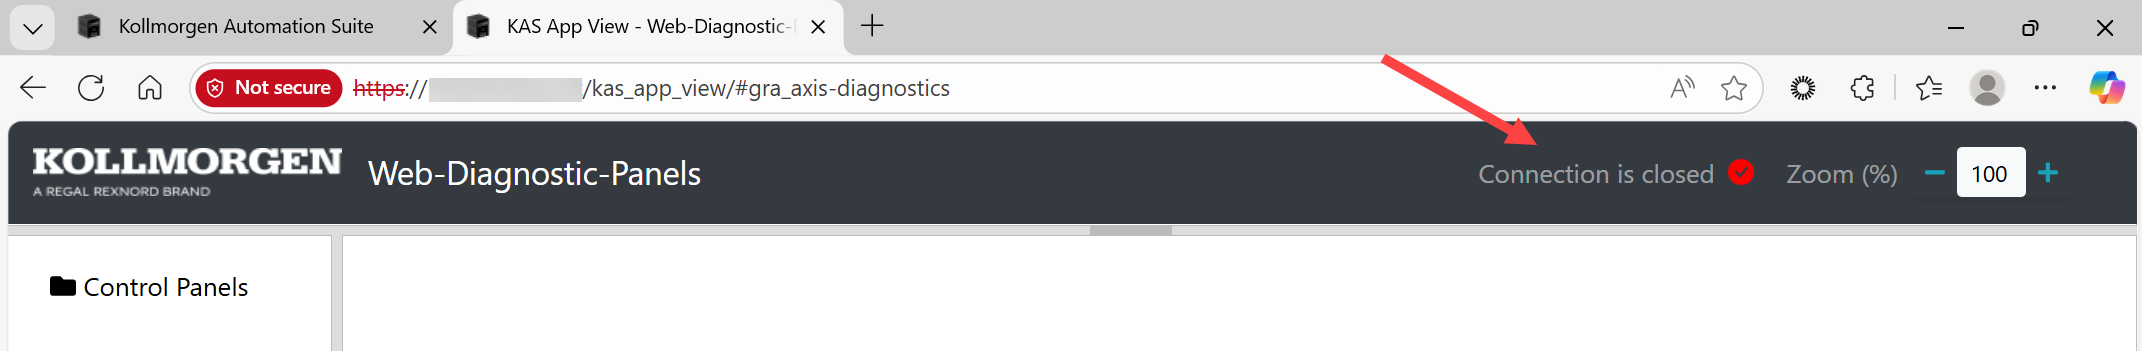
- During this time, widgets in the panel stop refreshing with new data.
- Text widgets may display a question mark (?) or remain blank.
- This indicates there is no active connection to the KAS Web server.
- To restore the connection and update the data, reload the page using the browser’s refresh option.
- When the KAS project is not running, the top bar shows this message: PLC: Stopped. (Figure 4)
- During this time, widgets in the panels are inactive.
- Text widgets may show a question mark (?) or remain blank.
- When the project starts, the status bar and data update automatically.
- If data does not refresh, reload the page using the browser’s refresh option.

Figure 4: Diagnostic Panel - PLC Stopped
See Also