Understanding a Bode Plot
The Bode Tool has 5 types of plots available for analysis
-
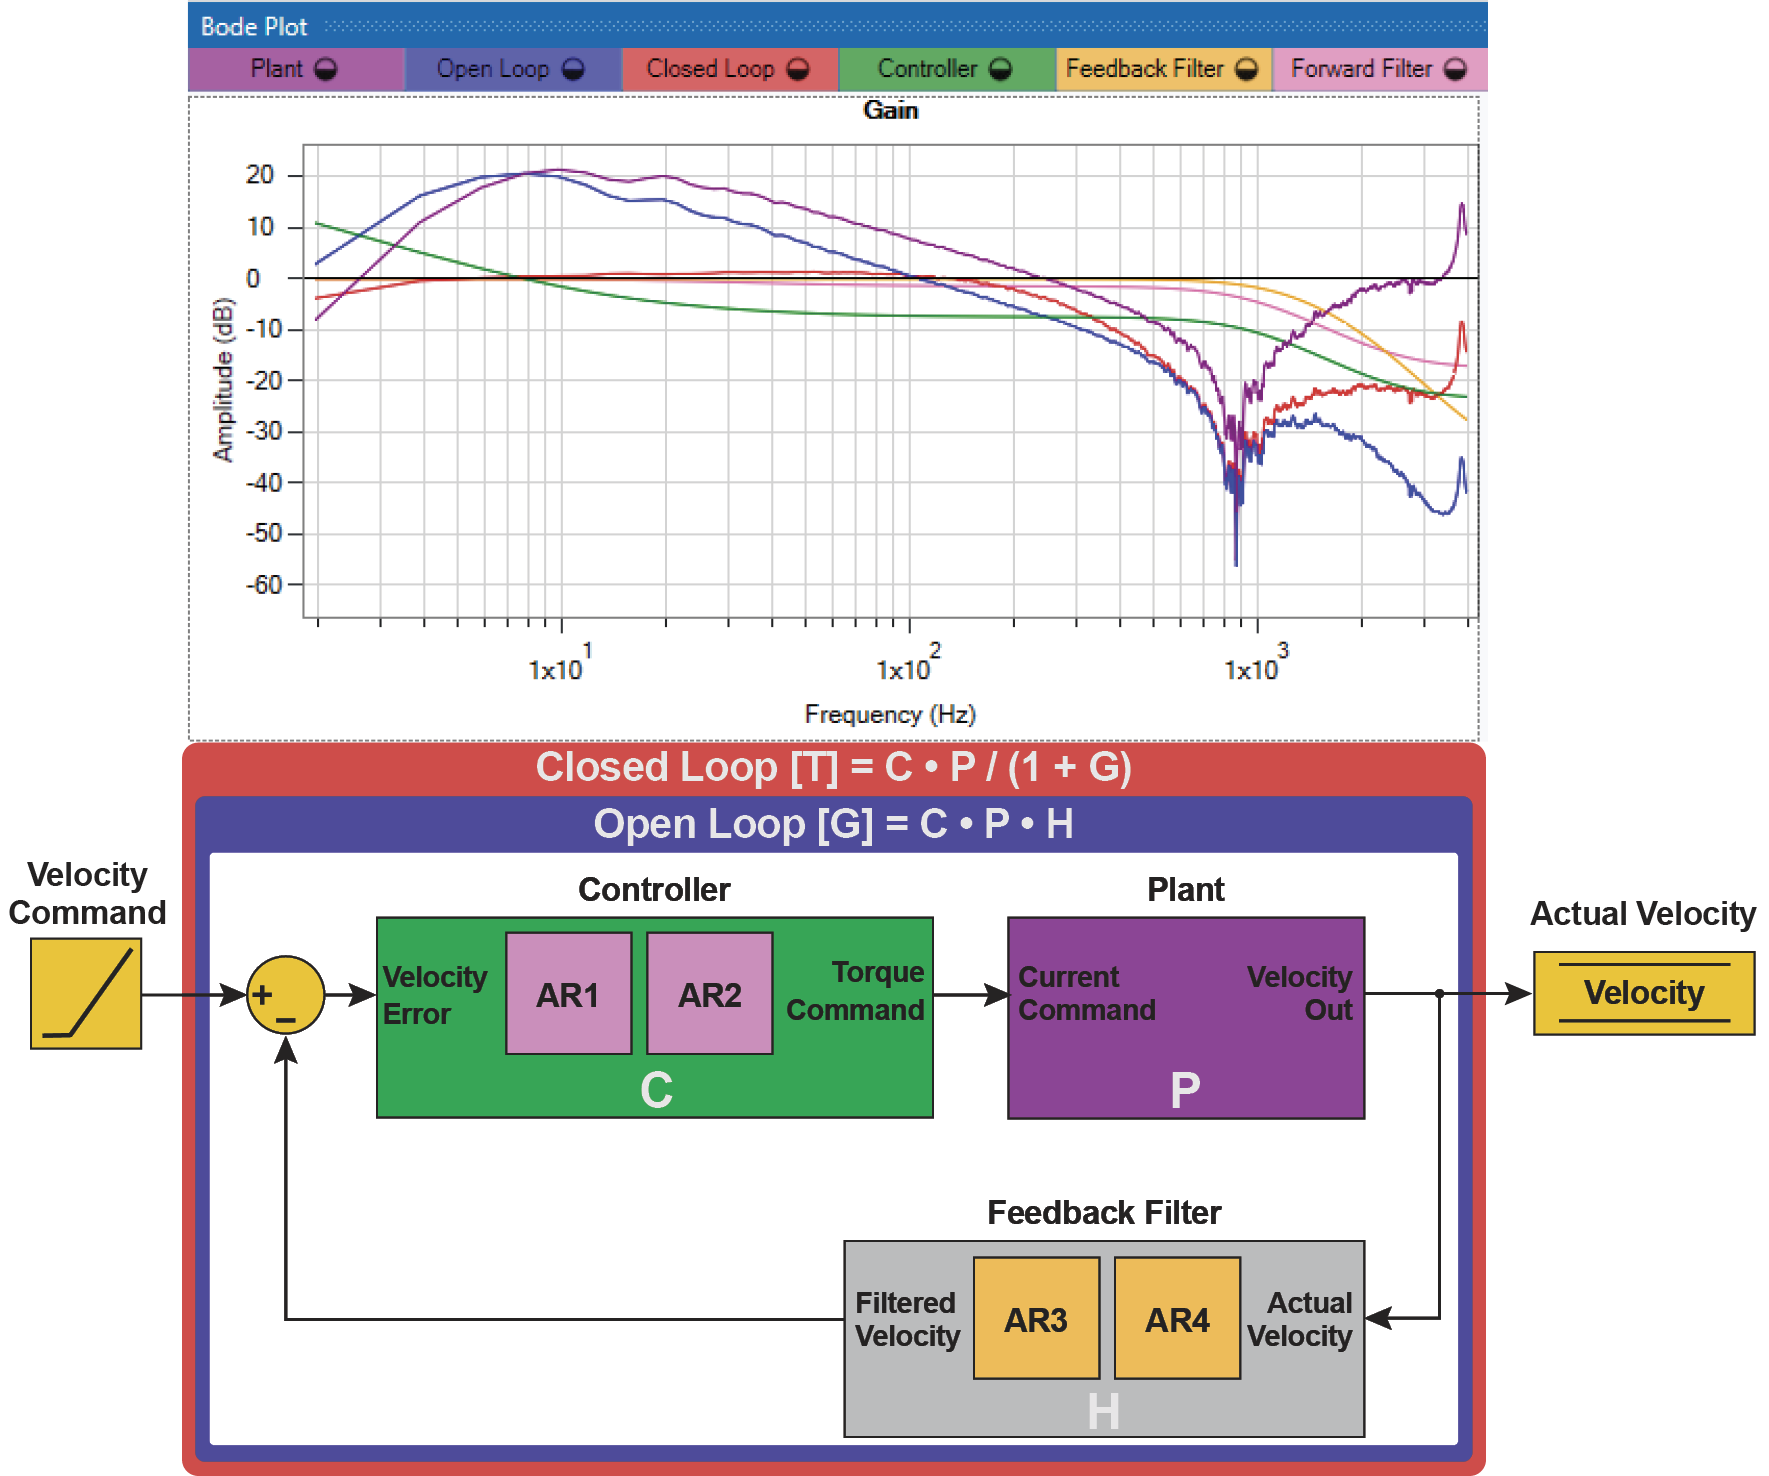
Plant [P] : The Plant measurement represents the physical system + the Servo Drive response
-
Controller [C] : The Controller plot shows the frequency response of Biquad 1, Biquad 2, VL.KP, VL.KI and PL.KP
-
Feedback Filters [H] : The Feedback Filters plot shows the frequency response of Biquad 3 and Biquad 4
-
Open Loop [G] : The Open Loop plot is equal to the Plant response multiplied by the Controller G = C * P * H (in log, this is a simple addition G = C + P + H)
-
Closed Loop [T] = The Closed Loop plot is equal to C * P / (1 + G)
Analyzing the Plots
Here is what each of the plots means to the user:
-
Plant [P]: This is the "DNA" of your system. It tells how the physical system will react under every type of motion or disturbance at every frequency. It shows what natural frequencies have resonances, how much inertia is in the system, and any compliance in mechanical linkages.
-
Controller [C]: This is the "brains" of a servo system. This is where the user can add and subtract gains, and correct resonances that are native to the plant.
-
Feedback Filters [H]: This is an extension of the Controller which only shapes the feedback of the Plant, not the command to the Plant.
-
Open Loop [G]: This shows the maximum performance of the physical system in response to any command, determined by the tuning gains.
-
Closed Loop [T]: This shows how the physical system will respond given a command or disturbance. This trace indicates where resonances and unstable oscillations will occur based on the current tuning (and current Gain / Phase margins).
Control Loop and Bode Plots
The plots are on a Bode plot, and allow you to visually represent the control loop and its effects your mechanics.