
Below are available basic objects you can insert in your graphics:
|
|
|
|
|
|
|
|
|
|
|
|
|
|
|
|
Meters...
|
|
|
|
|
|
|
|
|
|
|
|
|
A collection of basic drawings is available. Each object can be either static, or linked to a variable used to enable its visibility (show/hide).
Properties:
Identifier
Aspect
Variable symbol
Spying delay
Border size
Border color
Data format
Color when not connected
Background color
Background mode
Text
Text color
Text mode
Font name
Font size
TRUE color
FALSE color
Direction
Bitmap file (BMP, GIF, JPG) can be inserted in the graphic area.
Properties:
Identifier
Border size
Border color
Border style
Background color
Background mode
Text
Text color
Text mode
Font name
Font size
Pathname
Bitmap display mode
Large bitmaps are time-consuming during animation and can lead to poor performance, mainly if they have the "STRETCH" display mode or the "TRANS" (transparent) background mode.
Graphics need to be made portable with a project, otherwise the KAS IDE"Integrated development environment"
An integrated development environment is a type of computer software that assists computer programmers in developing software.
IDEs normally consist of a source code editor, a compiler and/or interpreter, build-automation tools, and a debuggerwill attempt to point to the original location of the graphic files. To make graphics portable, copy them to c:\Users\[user folder]\AppData\Local\Kollmorgen\Project\Controller\PLC"Programmable Logic Controller"
A Programmable Logic Controller, PLC, or Programmable Controller is a digital computer used for automation of industrial processes, such as control of machinery on factory assembly lines.
Used to synchronize the flow of inputs from (physical) sensors and events with the flow of outputs to actuators and events. After this the graphics are a part of the .KAS file.
![]()
Scales are static drawings representing an X or Y axis, generally used to document other objects such as trend charts or bargraphs.
Properties:
Identifier
Border size
Border color
Border style
Background color
Background mode
Text
Text color
Text mode
Font name
Font size
Minimum value
Maximum value
Direction
Placement
Nb divisions (main)
Nb divisions (small)
Scale color
![]()
Static, animated or edit text boxes are available for displaying / forcing variables. For edit boxes at runtimeIn computer science, runtime (or run-time) describes the operation of a computer program, the duration of its execution, from beginning to termination (compare compile time). Within KAS, runtime also refers to the virtual machine that manage the program written in a computer language while it is running, double-click on the object to enter the value and then hit ENTER to validate the input.
Properties:
Identifier
Variable symbol
Spying delay
Border size
Border color
Border style
Data format
Background color
Background mode
Text
Text color
Text mode
Font name
Font size
Action
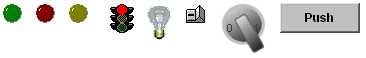
Buttons, switches and 2-state displays are used for control or display of a Boolean variable.
Properties:
Identifier
Aspect
Variable symbol
Spying delay
Border size
Border color
Data format
Data color
Background color
Background mode
Text
Text color
Text mode
Font name
Font size
Action
Pathname for "TRUE" state
Pathname for "FALSE" state
Bitmap display mode
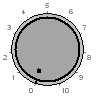
Analog buttons are used for setting the value of an integer or real variable. The mouse is used for setting the value.
Properties:
Identifier
Variable symbol
Spying delay
Border size
Border color
Border style
Data format
Data color
Background color
Background mode
Text
Text color
Text mode
Font name
Font size
Minimum value
Maximum value
Scale color
![]()
Bargraphs are rectangles filled according to the value of an analog variable. Bargraphs can be horizontal or vertical.
Properties:
Identifier
Variable symbol
Spying delay
Border size
Border color
Border style
Data format
Data color
Background color
Background mode
Text
Text color
Text mode
Font name
Font size
Minimum value
Maximum value
Direction
![]()
Charts enable the tracing of a variable as with an oscilloscope.
Properties:
Identifier
Aspect
Variable symbol
Spying delay
Border size
Border color
Border style
Data format
Data color
Background color
Background mode
Text
Text color
Text mode
Font name
Font size
Minimum value
Maximum value
Nb of points
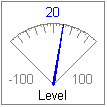
Analog meters provide a graphical display of an analog value.
Properties:
Identifier
Variable symbol
Spying delay
Border size
Border color
Border style
Data format
Data color
Background color
Background mode
Text
Text color
Text mode
Font name
Font size
Minimum value
Maximum value
Scale color
Nb divisions (main)
Nb divisions (small)
![]()
Sliders are used for entering an analog value with a horizontal or vertical mouse driven cursor.
Properties:
Identifier
Variable symbol
Spying delay
Border size
Border color
Border style
Data format
Data color
Background color
Background mode
Text
Text color
Text mode
Font name
Font size
Minimum value
Maximum value
Scale color
Direction

Digital meters (digits) display the value of a variable with the same aspect as a digital clock.
Properties:
Identifier
Aspect
Variable symbol
Spying delay
Border size
Border color
Border style
Data format
Data color
Background color
Background mode
Text
Text color
Text mode
Font name
Font size
Minimum value
Maximum value
![]()
Links are mouse-driven hyperlinks that are used as shortcuts to open another graphic document. Using links enables the design of multi-page animated applications.
Properties:
Identifier
Border size
Border color
Background color
Background mode
Text
Text color
Text mode
Font name
Font size
Link
Connection status is a box actuated with the current status of the connection and the connected run-timeIn computer science, runtime (or run-time) describes the operation of a computer program, the duration of its execution, from beginning to termination (compare compile time). Within KAS, runtime also refers to the virtual machine that manage the program written in a computer language while it is running application. It is mainly dedicated to diagnostic.
Properties:
Identifier
Spying delay
Border size
Border color
Border style
Data format
Data color
Background color
Background mode
Text
Text color
Text mode
Font name
Font size
BitsField allows you to display a Real value into a binary form.
The main properties are:
|
Stay Connected with Kollmorgen       
|
Copyright © 2015 Kollmorgen™ |

|