Double-clicking an object will open the Graphic Item Properties dialog box, which lists the properties particular to that object.
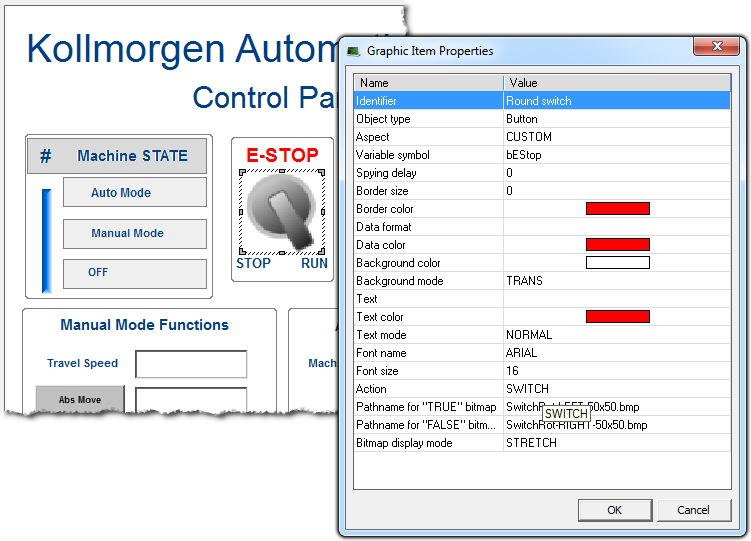
This page details all possible properties for graphic objects. Refer to the list of available objects for further information on which property is used for which object.
Double-clicking an object will open the Graphic Item Properties dialog box, which lists the properties particular to that object.
|
You can freely attach a text identifier to each graphic object inserted in a document. Identifiers are useful for arranging overlapped objects as they appear in the "Z-order" list. |
|||||||||||||
|
It is the full name of the application variable connected to the graphic object. In case of a local variable, its symbol must be prefixed with the parent program name, separated with "/". Example: "MyProg/MyVar". |
|||||||||||||
|
It is the minimum period for actuating the value of the connected variable, expressed as a number of milliseconds. If the delay is not specified or equal to 0, refresh is done as fast as possible. |
|||||||||||||
|
This property indicates the width of the border drawn around the object, expressed as a number of pixels. If this property is 0, then no border is drawn. |
|||||||||||||
|
This property indicates the color of the border drawn around the object. |
|||||||||||||
|
This property indicates the possible 3D effect used for drawing the border around the object. Possible values are: FLAT = no 3D effect |
|||||||||||||
|
This property indicates the color used for inserting texts in the graphic object. |
|||||||||||||
|
This property indicates the font effect used for drawing texts in the graphic object. Possible values are: HIDE = text is not displayed |
|||||||||||||
|
This property indicates the name of the character font used for drawing texts in the graphic object. |
|||||||||||||
|
This property indicates the size of the character font used for drawing texts in the graphic object. The size is expressed as a percentage of the actual height of the object. Maximum possible value is 100. This ensures that the ratio is kept when the object is resized. |
|||||||||||||
|
This property indicates the color used for filling the background of the object. In case of a bitmap, it specifies the color that must not be drawn if the TRANS (transparent) background mode is specified. |
|||||||||||||
|
This property indicates whether the background of the object must be filled or not. If this property is OPAQUE, then the background is filled with the specified background color. If this property is TRANS (transparent) then the background is not filled. Transparent drawing mode can be useful in the case of overlapping objects.
|
|||||||||||||
|
If defined, this property indicates that the value of the connected variable must be displayed on the graphic object. You must specify for this property a format string that indicates how the data will be formatted.
Format string has the same format as the famous "printf" function of "C" language. It can include static characters together with one of the following possible pragmas that specify the value: %s = default formatting according to IEC"International Electrotechnical Commission"
IEC is a not-for-profit, non-governmental international standards organization that prepares and publishes International Standards for all electrical, electronic and related technologies syntax Below are some examples:
|
|||||||||||||
|
If defined, this property indicates the text to be displayed on the graphic object.
|
|||||||||||||
|
For bitmap-based objects, this property indicates whether the attached bitmap must keep its original aspect or be stretched to the actual size of the object. Possible values are: ORIGINAL = keep the original aspect of the bitmap (cut if too large)
|
|||||||||||||
|
For analog animated objects (meters, bar graphs or trends) this property indicates the minimum possible value that can be displayed. For static scales, it indicates the value of the lowest mark. |
|||||||||||||
|
For analog animated objects (meters, bar graphs or trends) this property indicates the maximum possible value that can be displayed. For static scales, it indicates the value of the highest mark. |
|||||||||||||
|
This property indicates the color used to represent the value of a connected variable within the object (for example the filled part of a bar graph). |
|||||||||||||
|
For objects including a graphic scale, this property indicates the number of main division marks to be drawn in the scale. |
|||||||||||||
|
For objects including a graphic scale, this property indicates the number of small division marks to be drawn in the scale, between each main division mark. |
|||||||||||||
|
For objects including a graphic scale, this property indicates the color used for drawing the axis, the division marks and corresponding values of the scale. |
|||||||||||||
|
For bitmaps, this property specifies the pathname of the bitmap to be displayed. BMP, GIF and JPG formats are supported. If no directory is specified, the specified file name is searched:
|
|||||||||||||
|
For two-state objects having the "CUSTOM" aspect, this property specifies the pathname of the bitmap to be displayed when the value of the attached variable is TRUE (or not zero for analogs). BMP, GIF and JPG formats are supported. If no directory is specified, the specified file name is searched:
|
|||||||||||||
|
For two-state objects having the "CUSTOM" aspect, this property specifies the pathname of the bitmap to be displayed when the value of the attached variable is FALSE (or zero for analogs). BMP, GIF and JPG formats are supported. If no directory is specified, the specified file name is searched:
|
|||||||||||||
|
For shapes, this property indicates the color used for filling shapes when no variable is attached to the graphic object. |
|||||||||||||
|
For shapes, this property indicates the color used for filling shapes when the attached variable has the TRUE state, or non zero for analogs. |
|||||||||||||
|
For shapes, this property indicates the color used for filling shapes when the attached variable has the FALSE state, or zero for analogs. |
|||||||||||||
|
For oriented shapes such as triangles, half ellipses or cylinders, this property indicates the direction of the drawing; to the left, to the right, to the top or to the bottom. |
|||||||||||||
|
For scales, this property indicates the direction of the axis. If LEFT, the minimum value is on the left side. If RIGHT, the minimum value is on the right side. |
|||||||||||||
|
For scales, this property indicates the location of the scale within the object rectangle: on the left, on the right, on the top or at the bottom. |
|||||||||||||
|
Indicates the possible mouse actions for text boxes. The following values are possible: STATIC = no mouse action |
|||||||||||||
|
Indicates the possible mouse action for switches. The following values are possible: STATIC = no mouse action |
|||||||||||||
|
For bar graphs, this property indicates the growing direction: to the left, to the right, to the top or to the bottom. |
|||||||||||||
|
For trend charts, this property indicates the maximum number of stored points. If the width of the object (in pixels) is less than this number, then oldest points are not visible. |
|||||||||||||
|
For slider, this property indicates whether the slider is horizontal (RIGHT) or vertical (TOP). |
|||||||||||||
|
This property indicates the name of the target .GRA animated document for shortcuts. If no directory is specified in the link, then the file is searched in the project folder. |
|||||||||||||
|
This property indicates the type of basic shape to be drawn. Possible aspects are: CYLINDER = a 3D like cylinder |
|||||||||||||
|
This property indicates the type of switch to be drawn. Possible aspects are: DEFAULT = a standard Windows-like push button |
|||||||||||||
|
This property indicates the type of drawing for a trend chart. Possible aspects are: POINT = only relevant dots are drawn |
|||||||||||||
|
This property indicates the type of drawing for a digital meter. Possible aspects are: DEFAULT = plain drawing |
|
Stay Connected with Kollmorgen       
|
Copyright © 2015 Kollmorgen™ |

|