View SFC charts
At any moment you can zoom in or out of the edited diagram using a Ctrl + mouse-wheel operation. You can also press the [+] and [-] keys of the numerical keypad to zoom the diagram in or out.
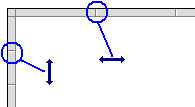
You can also drag the separation lines in vertical and horizontal rulers to resize the cells of the grid:

The SFC![]() "Sequential function chart"
It can be used to program processes that can be split into steps.
The main components of SFC are:
- Steps with associated actions
- Transitions with associated logic conditions
- Directed links between steps and transitions Editor adjusts the size of the font
according to the zoom ratio. When a cell is wide enough, a text is displayed with
the contents of the step or transition (level 2). The last button of the toolbar enables you to switch between displays:
"Sequential function chart"
It can be used to program processes that can be split into steps.
The main components of SFC are:
- Steps with associated actions
- Transitions with associated logic conditions
- Directed links between steps and transitions Editor adjusts the size of the font
according to the zoom ratio. When a cell is wide enough, a text is displayed with
the contents of the step or transition (level 2). The last button of the toolbar enables you to switch between displays:
|
|
Swap between possible overviews of level 2 in
the level 1 chart: - display code of actions and conditions - display notes attached to steps and transitions |


