Log Messages Settings
The KAS IDE![]() "Integrated development environment"
An integrated development environment is a type of computer software that assists computer programmers in developing software.
IDEs normally consist of a source code editor, a compiler and/or interpreter, build-automation tools, and a debugger
"Integrated development environment"
An integrated development environment is a type of computer software that assists computer programmers in developing software.
IDEs normally consist of a source code editor, a compiler and/or interpreter, build-automation tools, and a debugger
- Configuration Settings define what is recorded in the database.
- Filtering defines which messages are displayed in the table widget.
Configuration Settings
|
|
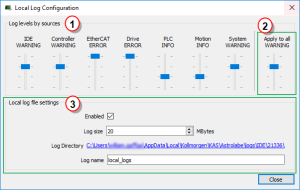
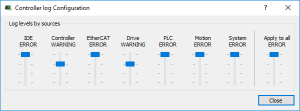
Figure 3-3: Configuration of the Local and Controller Log Messages
| Call Out# | Description |
|---|---|
|
|
Each log source can be set with its own notification level.
|
|
|
You can set or reset all the sliders with the same level value |
|
|
Logs can be recorded on the local machine as circular files.
|
|
Level |
Icon |
Description |
|---|---|---|
| CRITICAL |

|
Application crashes or becomes unstable.
|
| ERROR |
|
The application does not behave as expected but the processes remain stable. |
| WARNING |
|
System is stable but the KAS IDE warns that an unexpected event can occur.
|
| INFO |
|
Information status of the current process. You can ignore this log. |
| DEBUG |
|
Any information logged for development purpose. You can ignore this log. |
Each message has one of these levels, with importance in ascending order:
DEBUG > INFO > WARNING > ERROR > CRITICAL
Log files are a group of small files where all the last logs are recorded. Each log is recorded as a separated line.
-
-
You can import the log files into Microsoft Excel using drag-and-drop.
| Field | Description |
|---|---|
| Enabled | The Log File Settings has to be enabled to record all the logs. |
| Log size |
To prevent any overflow, you can define the maximum size on disk dedicated to the group of local log files.
The number of rows can vary for each file, depending on what is in the backlog when KAS creates the log files. |
| Log Directory |
The Log Files are stored in this directory.
|
| Log name |
You can define the file name prefix to be used on the local machine (on the controller, the file name prefix is: controller logs). The suffix to create the complete filename contains a timestamp
|
When a level is set for a source, only messages with the same or higher importance are recorded.
- Drag the level control slider Up to reduce the verbosity, Down to increase it.
- When the configuration leads to lower verbosity, the treatment during the filtering is quicker.
- Example: If a source is set to WARNING, then all messages with levels WARNING, ERROR and CRITICAL are recorded (DEBUG and INFO messages are discarded).
DEBUG is the most verbose, whereas ERROR is the less verbose.
- Example: If a source is set to WARNING, then all messages with levels WARNING, ERROR and CRITICAL are recorded (DEBUG and INFO messages are discarded).
-
-
Critical messages are always recorded; as a consequence, the Critical level is not visible on the slider.
- For the local machine (IDE), the Log files are located in the following location:
C:\Users\(user name)\AppData\Local\Kollmorgen\KAS\Astrolabe\logs\IDE\(process ID) - For the controller, the Log files are located under:
C:\Users\(user name)\AppData\Local\Kollmorgen\KAS\Sinope Simulator\Application\logs - The AKD PDMM or PCMM logs are accessed via the web server page by browsing to:
KAS Application > Log Data.
-
- AKD PDMM/PCMM generated logs may be configured through the webpage.
See Controller Log Files for more information on those controller logs.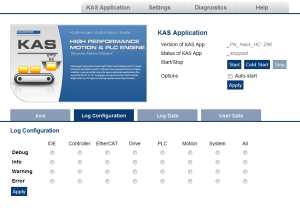
-
-
It is recommended that you use either the IDE or web page method, but not both.
The communication is unidirectional and the configuration is not read at runtime In computer science, runtime (or run-time) describes the operation of a computer program, the duration of its execution, from beginning to termination (compare compile time).
Within KAS, runtime also refers to the virtual machine that manage the program written in a computer language while it is running.
Filtering
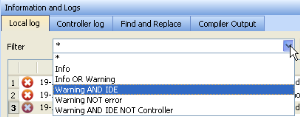
You can narrow the list of recorded messages by specifying a filter.
The filter is applied on all the strings displayed on each row of the table widget (i.e., Time, Source, Level and Message).
The drop-down menu gives access to some predefined filters, which can also be edited.
Figure 3-4: Filtering the Messages
Example: Filtering with Warning NOT error means that only the lines including the word "warning" but not the word "error" are listed.
Filtering Rules
These are the filter rules:
- You can combine several strings by including one of these Boolean operands:
- OR
- AND
- NOT (or use the exclamation mark "!")
- Several keywords separated with spaces are considered as an exact string.
- Filtering is not case sensitive.
Figure 3-5: Example: Filtering the Messages
-
- When you apply the filter, all the currently recorded messages are parsed and displayed if they match the filter.
But all the upcoming recorded messages are added as new rows at the end of the table widget with no filtering.
Log Scrolling
If you select a message in the table, the scrolling is stopped.
All the upcoming recorded messages are added at the end of the list, but the selected message always remains in the same place (you have to scroll down to make the most recent messages visible).
If you select the last row of the table (shortcut: Alt+Page Down), the scrolling is active.
The last recorded message is always selected and visible at the bottom of the table.


