Log Data tab
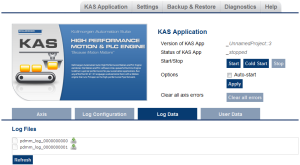
KAS log files may be viewed from the Log Data tab. These messages can help describe the current state of the system and to help identify any operation errors encountered when developing your system.
Figure 5-5: Example of Log Files from a Kollmorgen Controller's Webserver
Click a listed log file to open it in a web browser.
- Click the green download icon next to the log entry to download the log file.
- The default name is the same as the file's name.
- If a file no longer exists, the message /logfiles/<selected file name> not found. appears.
- Refresh the browser window and try again.
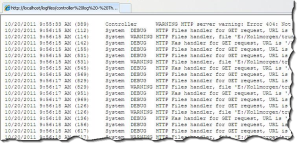
Figure 5-6: Example of a log file's content in a browser.
-
-
Controller log data is collected and updated every 15 seconds.
A new log file is created when the current file is full.
You may need to wait for up to 15 seconds for a log to show up in the list.
AKD PDMM and PCMM
The AKD PDMM and PCMM log files both have the same file naming scheme: pdmm_log_xxxxxxxxxx.
PCMM2G Only
- The file error_alarm_history.log contains a history of errors and alarms.
- Files whose names begin with an underscore are internal.
- They may be requested by support engineers during troubleshooting.
Log Message Content
Log files contain one message per line, formatted as a CSV file.
Every log message contains this information:
|
Field |
Description |
|
Time |
Time when the log was recorded with the format: DD-MMMM-YY hh:mm:ss (millisecond) |
|
Source |
Identifies a software or hardware component issuing the messages. Each source is configured with a specific Level. See Log Messages Settings for more information. |
|
Level |
Each message has one of these levels with importance in ascending order: DEBUG > INFO > WARNING > ERROR > CRITICAL. See Log Messages Settings for more information. |
|
Message |
Text of the message issued from the source. |
|
Origin |
The source code line where the message originated. |


