Graphic Objects Properties
This page details all possible properties for graphic objects. Refer to the list of available objects for further information on which property is used for which object.
-
-
Double-click an object to open the Graphic Item Properties dialog box.
This dialog lists the properties particular to that object.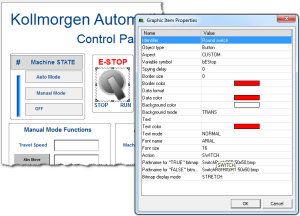

|
Name |
Description |
||||||||||||
|---|---|---|---|---|---|---|---|---|---|---|---|---|---|
|
Indicates the possible mouse action for switches. Possible values are:
|
|||||||||||||
|
Indicates the possible mouse actions for text boxes. Possible values are:
|
|||||||||||||
|
Indicates the type of drawing for a digital meter. Possible aspects are:
|
|||||||||||||
|
Indicates the type of basic shape to be drawn. Possible aspects are:
|
|||||||||||||
|
Indicates the type of switch to be drawn. Possible aspects are:
|
|||||||||||||
|
This property indicates the type of drawing for a trend chart. Possible aspects are:
|
|||||||||||||
|
Indicates the color used for filling the background of the object. In case of a bitmap, it specifies the color that must not be drawn if the TRANS (transparent) background mode is specified. |
|||||||||||||
|
Indicates whether the background of the object must be filled or not.
|
|||||||||||||
|
For bitmap-based objects, this indicates whether the attached bitmap must keep its original aspect or be stretched to the actual size of the object. Possible values are:
|
|||||||||||||
|
For two-state objects with the CUSTOM aspect, this specifies the pathname of the bitmap to display when the value of the attached variable is FALSE (or zero for analogs).
|
|||||||||||||
|
For two-state objects with the CUSTOM aspect, this specifies the pathname of the bitmap to display when the value of the attached variable is TRUE (or not zero for analogs).
|
|||||||||||||
|
For bitmaps, this specifies the pathname of the bitmap to be displayed.
|
|||||||||||||
|
Indicates the color of the border drawn around the object. |
|||||||||||||
|
Indicates the width of the border drawn around the object, expressed as a number of pixels. If this property is 0 (zero), no border is drawn. |
|||||||||||||
|
Indicates the possible 3D effect used for drawing the border around the object. Possible values are:
|
|||||||||||||
|
For shapes, this indicates the color used for filling shapes when no variable is attached to the graphic object. |
|||||||||||||
|
Indicates the color used to represent the value of a connected variable within the object (e.g., the filled part of a bar graph). |
|||||||||||||
|
If defined, this indicates that the value of the connected variable must be displayed on the graphic object. This property requires a specified format string that indicates how the data is to be formatted.
Format string has the same format as the printf function of "C" language. It can include static characters together with one of these possible pragmas that specify the value:
Examples
|
|||||||||||||
|
For bar graphs, this indicates the growing direction: to the left, right, top, or bottom. |
|||||||||||||
|
For oriented shapes such as triangles, half ellipses or cylinders, this indicates the direction of the drawing: to the left, right, top, or bottom. |
|||||||||||||
|
For scales, this indicates the direction of the axis.
|
|||||||||||||
|
For slider, this indicates whether the slider is horizontal (RIGHT) or vertical (TOP). |
|||||||||||||
|
For shapes, this indicates the color used for filling shapes when the attached variable has the FALSE state, or zero for analogs. |
|||||||||||||
|
Indicates the name of the character font used for drawing texts in the graphic object. |
|||||||||||||
|
Indicates the size of the character font used for drawing texts in the graphic object.
|
|||||||||||||
|
Freely attach a text identifier to each graphic object inserted in a document. Identifiers are useful for arranging overlapped objects as they appear in the Z-order list. |
|||||||||||||
|
Indicates the name of the target .
|
|||||||||||||
|
For analog animated objects (e.g., meters, bar graphs, or trends) this indicates the maximum possible value that can be displayed. For static scales, it indicates the value of the highest mark. |
|||||||||||||
|
For analog animated objects (e.g., meters, bar graphs or trends) this indicates the minimum possible value that can be displayed. For static scales, it indicates the value of the lowest mark. |
|||||||||||||
|
For objects including a graphic scale, this indicates the number of main division marks to be drawn in the scale. |
|||||||||||||
|
For objects including a graphic scale, this indicates the number of small division marks to be drawn in the scale, between each main division mark. |
|||||||||||||
|
For trend charts, this indicates the maximum number of stored points. If the width of the object (in pixels) is less than this number, then oldest points are not visible. |
|||||||||||||
|
For gauges, this is the color of the needle. |
|||||||||||||
|
For scales, this indicates the location of the scale within the object rectangle: on the left, right, top, or bottom. |
|||||||||||||
|
For objects including a graphic scale, this indicates the color used for drawing the axis, the division marks, and corresponding values of the scale. |
|||||||||||||
|
It is the minimum period for actuating the value of the connected variable, expressed as a number of milliseconds. If the delay is not specified or equal to 0 (zero), refresh is done as fast as possible. |
|||||||||||||
If defined, this indicates the text displayed on the graphic object.
|
|||||||||||||
|
Indicates the color used for inserting texts in the graphic object. |
|||||||||||||
|
Indicates the font effect used for drawing texts in the graphic object. Possible values are:
|
|||||||||||||
|
For gauges, this is the text shown in the tile |
|||||||||||||
|
For gauges, this is the color of the title text. |
|||||||||||||
|
For gauges, this is the position of the title within the gauge. |
|||||||||||||
|
For shapes, this indicates the color used for filling shapes when the attached variable has the TRUE state, or non zero for analogs. |
|||||||||||||
|
This is the full name of the application variable connected to the graphic object. In case of a local variable, its symbol must be prefixed with the parent program name, separated with "/". Example: MyProg/MyVar |


