Breakpoints tab
The Breakpoints tab lists all of the breakpoints in the PLC program, including their position and status.
- Double-click an entry to move to that location in the editor.
- Breakpoints may be enabled and disabled singly by clicking the Status check boxes.
- Buttons on the left of the tab provide the ability to remove single breakpoints, enable and disable all breakpoints, and remove all breakpoints.
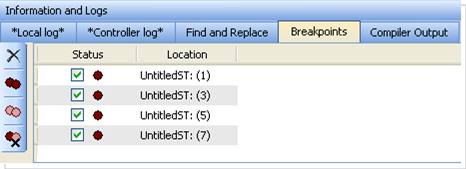
Figure 1: Breakpoints tab
| Button | Action Performed |
|---|---|

|
Delete selected breakpoint from the list and editor. |

|
Enable all breakpoints. This makes all breakpoints active. |

|
Disable all breakpoints. This makes all breakpoints inactive. |

|
Remove all breakpoints. |
Right-clicking a breakpoint entry in the list provides for enabling, disabling, deleting the entry, and going to that location in the source code.
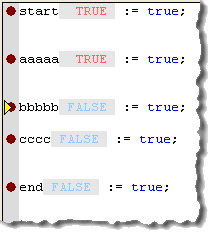
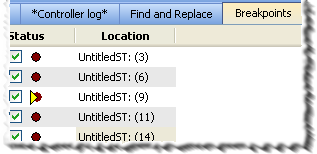
Breakpoints (both active and inactive) which have been reached in the code are flagged with a yellow triangle.
This provides a quick and easy way to identify the breakpoint.
This can be seen in both the code and the Breakpoints tab.
|
|
|
|
Figure 2: Breakpoints code |
Figure 3: Breakpoints tab |
-
-
Any program (except for an SFC program) that contains a breakpoint that gets "hit" during debugging will be automatically opened for your convenience.
As breakpoints set in SFC programs cannot be enabled or disabled, entries in the Breakpoints widget do not have a checkbox to perform these actions.
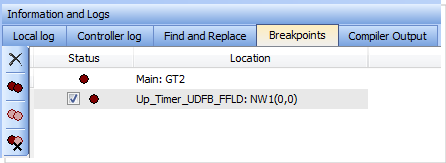
Figure 4: Example of a breakpoint (Main: GT2) set in an SFC program.
See Also


