Example: AKD PDMM and PCMM Over Loaded CPU
This example shows an application that is overloading an AKD PDMM or PCMM with the EtherCAT Cycle Time = 250 microseconds.
Specifically, this example looks at:
1. MotionExec and PLCProgExec Times
Use the techniques described in Practical Application: Using Trace Time To Measure CPU Load to examine the MotionExec and PLCProgExec times.
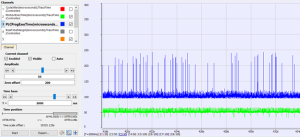
Figure 1: MotionExec and PLCProgExec Times
- The average MotionExec and PLCProgExec times are 57 + 110 = 167 microseconds.
- This is 67% (167 / 250) of the Cycle Time.
- Notice the big spikes on the PLCProgExec.
- The PLC cannot complete all the programs within one cycle period.
2. RealTimeMargin
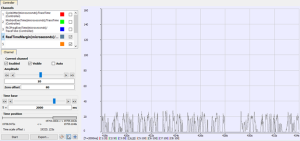
Figure 2: RealTimeMargin
- There is between 25 to 0 microseconds of margin.
- There are many cycles with zero real-time margin.
- This example shows up to 1 second of no real time margin available.
- This is a degraded case.
3. Controller Log
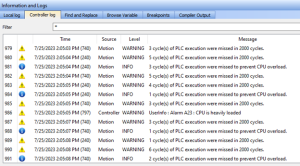
The Controller log confirms the missing VM cycles and an A23 alarm:
Figure 3: Controller log
4. CPU Load
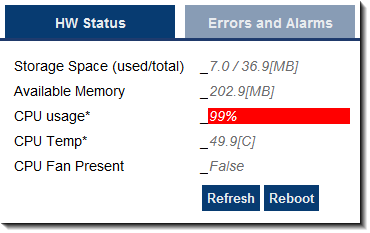
Look at the overall CPU load.
- This is 99%.
- Clearly this application is overloading the CPU:

Figure 4: CPU load
See Also


