Step-By-Step Debugging
![]() "Integrated development environment"
An integrated development environment is a type of computer software that assists computer programmers in developing software.
IDEs normally consist of a source code editor, a compiler and/or interpreter, build-automation tools, and a debugger in conjunction with the KAS Simulator allows checking and validating the application program prior to deployment of the machine/system in production. This is achieved by capturing critical events in a step-by-step mode.
"Integrated development environment"
An integrated development environment is a type of computer software that assists computer programmers in developing software.
IDEs normally consist of a source code editor, a compiler and/or interpreter, build-automation tools, and a debugger in conjunction with the KAS Simulator allows checking and validating the application program prior to deployment of the machine/system in production. This is achieved by capturing critical events in a step-by-step mode.
In addition to the cycle-by-cycle execution mode, the debugger has a rich collection of powerful features for making step-by-step debugging in the source code of your application.
-
-
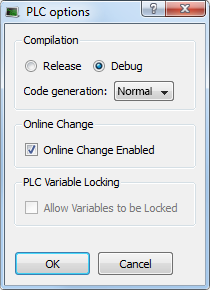
Step-by-step debugging is available only if the project has been compiled with the DEBUG option. This option can be selected from the project compiling PLC
 "Programmable Logic Controller"
A Programmable Logic Controller, PLC, or Programmable Controller is a digital computer used for automation of industrial processes, such as control of machinery on factory assembly lines.
Used to synchronize the flow of inputs from (physical) sensors and events with the flow of outputs to actuators and events options dialog box, accessible with the
  icon.
icon.

Figure 4-58: PLC Options - Debug Compiling Mode
- An application compiled in Debug mode includes additional information for stepping. This leads to bigger code size and reduced performance.
- When debugging is finished, it is recommended to compile your application in Release mode to give highest performance to your application.
Step-by-step debugging is available:
- In ST
 "Structured text"
A high-level language that is block structured and syntactically resembles Pascal and IL
 "Instruction list"
This is a low-level language and resembles assembly text programs (a step is considered as a statement)
 - In FFLD programs (a step is considered as a rung)
- In FBD
 "Function block diagram"
A function block diagram describes a function between input variables and output variables. A function is described as a set of elementary blocks (a step is considered as a graphic symbol corresponding to an action)
-
-
Step-by-step debugging is not possible in SFC
 "Sequential function chart"
It can be used to program processes that can be split into steps.
The main components of SFC are:
- Steps with associated actions
- Transitions with associated logic conditions
- Directed links between steps and transitions programs, see About SFC for more information.
There are two possibilities for entering the step-by-step debugging mode:
- Set a breakpoint in a program (for more details, see "About Breakpoints")
- When the target is in cycle stepping mode (STOP), you can step to the beginning of the first program.

When you start your application and the breakpoint is reached, the execution stops at the specified location and you can run one step further in the program with the stepping commands.
-
-
Pausing a program will not interrupt the current VM cycle. The current cycle will finish and execution will be paused before the beginning of the next VM cycle.
The following commands are available from the Debug Toolbar for stepping:
| Icon | Description |
|---|---|

|
Step Over the next instruction: |

|
Step Into the next instruction: |

|
Step Out the current block: |
In addition to these commands, you can click at any time:
| Icon | Description |
|---|---|

|
Execute the cycle (from the current position up to the end of the last program) |

|
Restart the target in "normal" execution mode (RUN) |


