Example: AKD PDMM and PCMM Heavily Loaded CPU
This example shows an application that is heavily loading a AKD PDMM or PCMM with the EtherCAT Cycle Time = 250 microseconds.
Specifically, this example looks at:
1. MotionExec and PLCProgExec Times
Using the techniques described in Practical Application: Using Trace Time To Measure CPU Load, examine the MotionExec and PLCProgExec times:
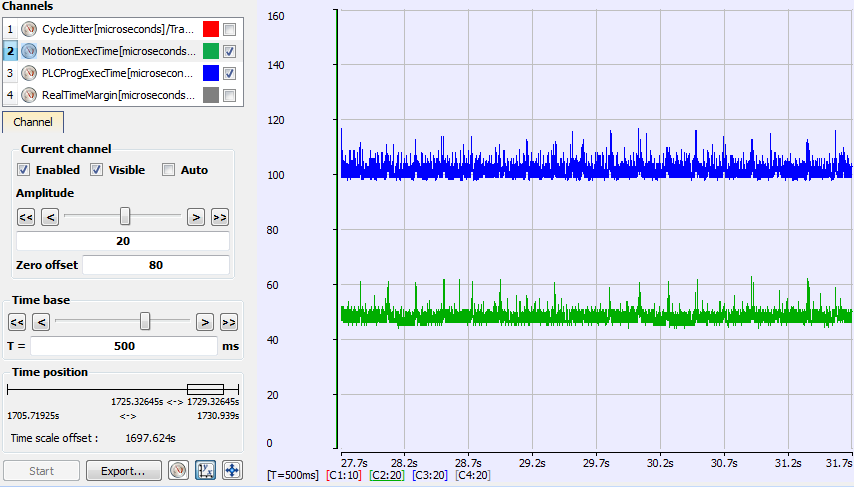
Figure 1: MotionExec and PLCProgExec Times
- The average MotionExec and PLCProgExec times are 50 + 105 = 155 microseconds.
- This is 62% (155 / 250) of the cycle time.
2. PLCProgExec Peaks
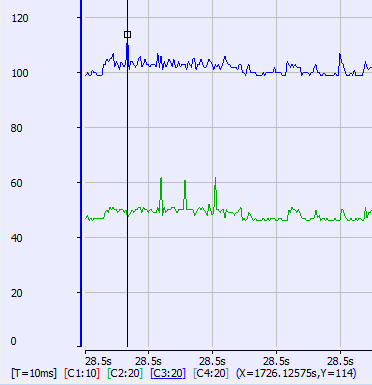
Figure 2: Peaks
This shows there is not much time left over:
- MotionExec = 62 microsec.
- PLCProgExec = 114.
3. RealTimeMargin
Next, look at the RealTimeMargin:
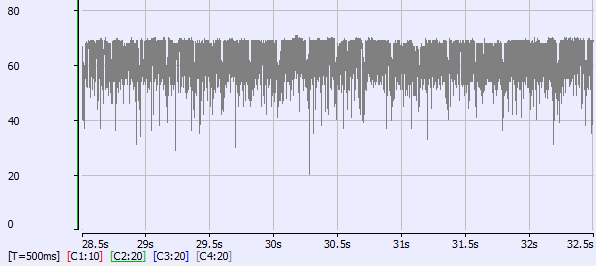
Figure 3: RealTimeMargin
- The minimum time is 20 microseconds.
- This is 8% Real-Time margin (20 / 250).
- This is not a comfortable margin for deterministic Real-Time performance.
4. Controller Log
The Controller log shows that the Virtual Machine (PLCProgExec) is occasionally missing a cycle:
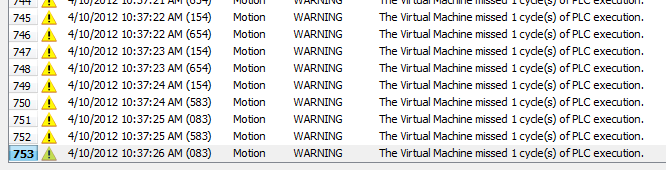
Figure 4: Controller Log
5. CPU Load
Look at the overall CPU load.
- This is 88%.
- There’s not much CPU bandwidth available.
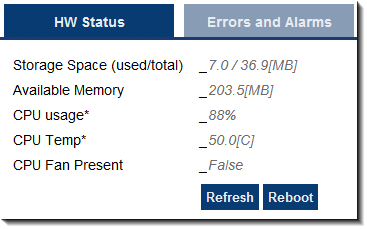
Figure 5: CPU load
See Also


