Example: PCMM2G Heavily Loaded CPU
This example shows an application that is heavily loading a PCMM2G with the EtherCAT Cycle Time = 250 microseconds.
Specifically, this example looks at:
1. MotionExec and PLCProgExec Times
Using the techniques described in Practical Application: Using Trace Time To Measure CPU Load, examine the MotionExec and PLCProgExec times:
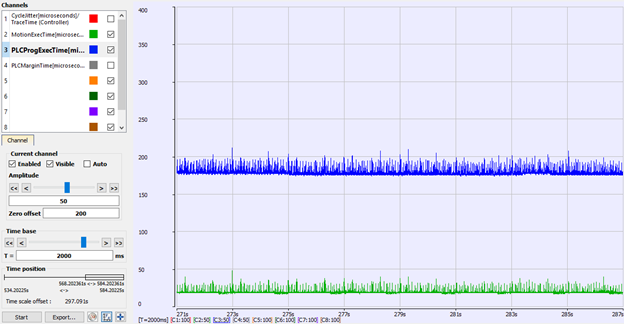
Figure 1: MotionExec and PLCProgExec Times
- The average MotionExec = 20 microseconds.
- This is about 8% (20 / 250) of the cycle time.
- The average PLCProgExec = 178 microseconds.
- This is about 71% (178 / 250) of the cycle time.
- Thus, the PLC programs have a much higher load.
2. PLCProgExec Peaks
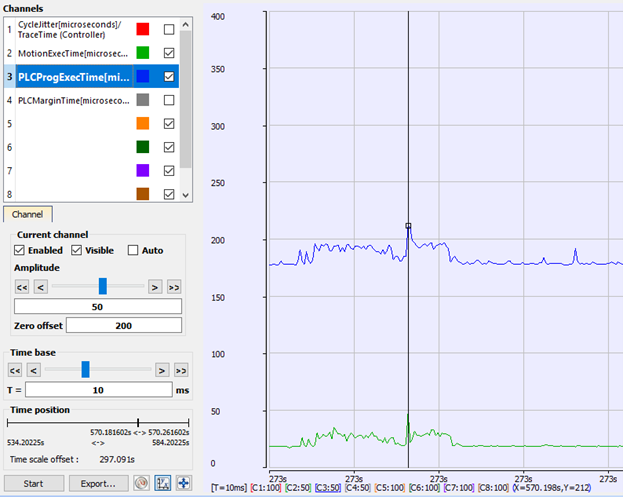
Figure 2: PLCProgExec Peaks
This shows there is not much time left over:
- PLCProgExec = 212.
3. PLCMarginTime
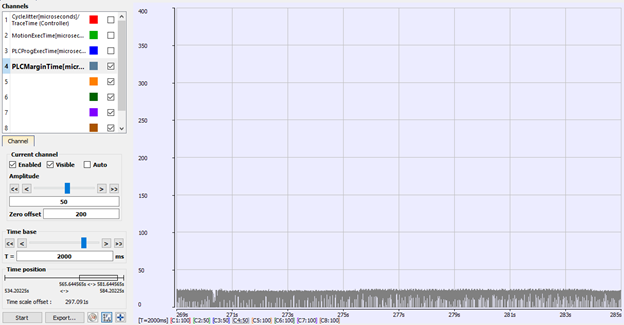
Figure 3: PLCMarginTime
- The PLCMarginTime is between 0 and 25 microseconds (0% to 10%).
- This is not a comfortable margin for deterministic PLC performance.
4. Controller Log
The Controller log confirms the occasionally missing PLC execution cycles:
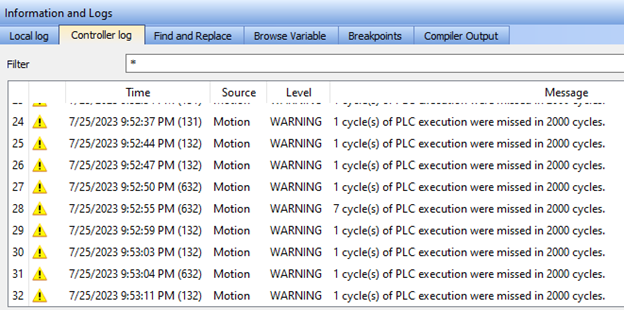
Figure 4: Controller Log
See Also


