This section walks through the process of utilizing the Simulation feature and Bode Plot to manually tune the system. Make tuning adjustments to the Feed Fowards first, then the gains, and finally the filters.
If you're manually tuning from scratch (zeroing out gains and filter settings), as we do in this example, first follow the Determining Feed Forwards procedure before tuning the gains and filters. If a previous automatic tuned response is being adjusted, the Feed Forwards are already set and you can skip the procedure.

Step 1: Read
Read the Safety warnings on the Tuning Getting Started Tab in WorkBench as well as Before Tuning is Started.
Step 2: Take a Measurement of the System [Plant]
|
To obtain a picture of the physical system response, a measurement of the Plant must be free from the influence of any feed-forwards, gains, or filters. It must not be influenced by the Controller and Control Loop.
|

|
Step 3: Evaluate the Plant Plot
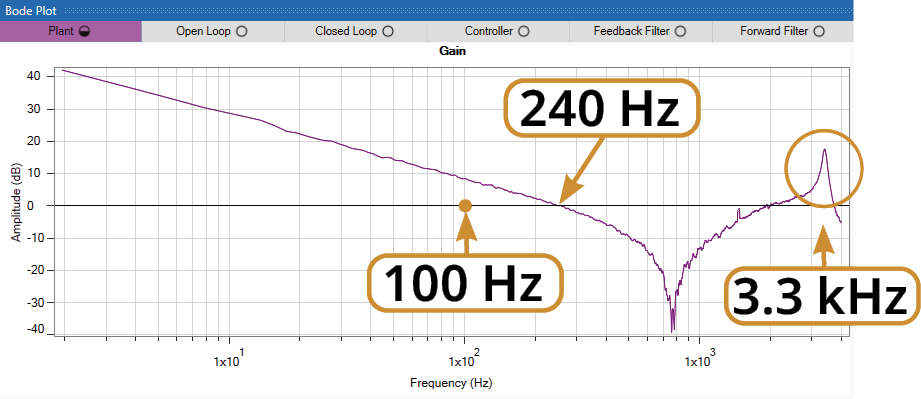
In this example, it's determined that 100 Hz is needed to deliver the desired system performance.
From the measured Plant plot, achieving 100 Hz bandwidth falls within the limits of the system and is therefore achievable. The physical limits of the system [Plant] cannot be exceeded without becoming unstable.
Also, note the resonance peak around 3.3 kHz. This is an area of instability that must be considered while tuning.

Step 4: Evaluate the Untuned System
|
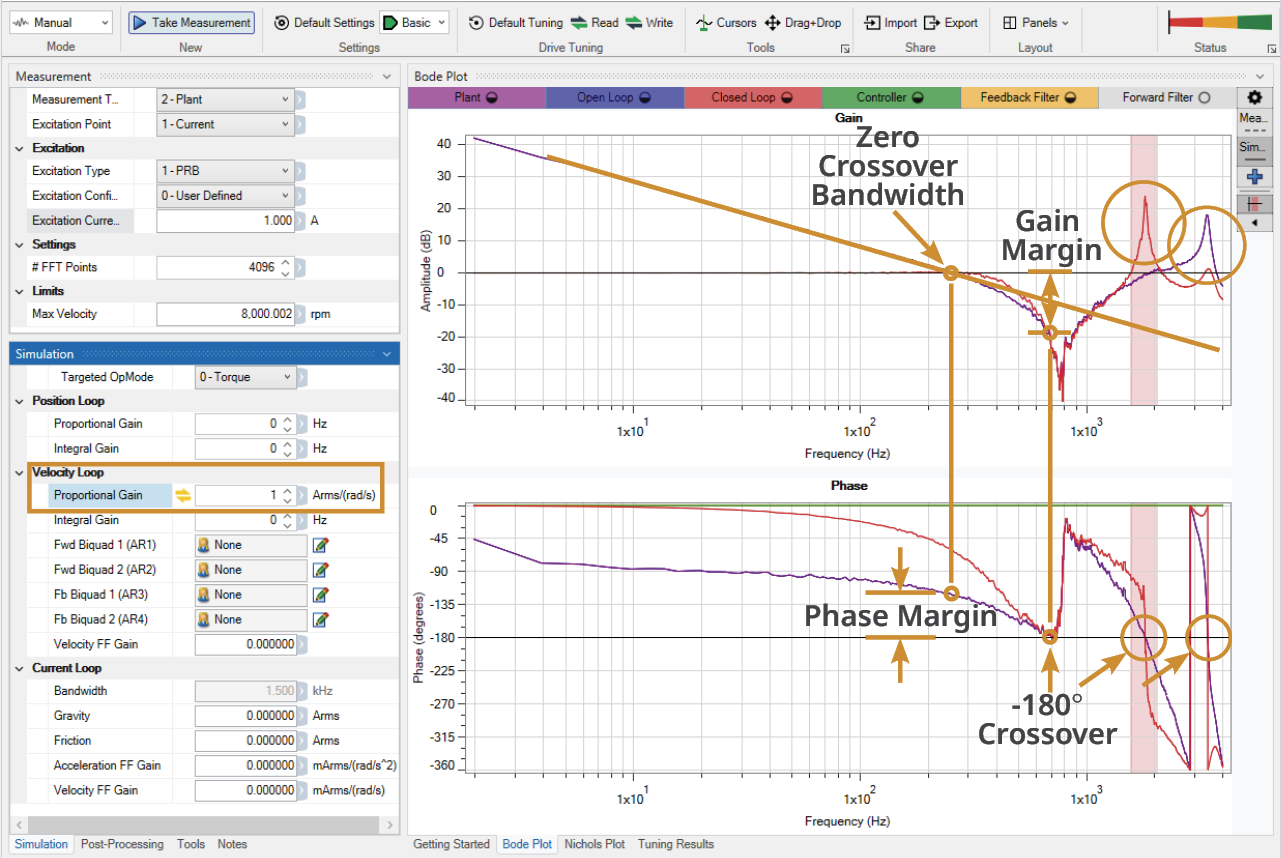
Disable the axis and within the Simulation pane, set the Velocity Loop Proportional Gain to 1, if not already set. This sets the Open Loop in unity with the Plant and shows the resulting Closed Loop response, since it is a function of the Open Loop. The Controller and Filter plots are still zeroed out. Note the closed loop resonance that occurs at 1.8 kHz and is caused by the lack of system phase margin as it crosses through -180 degrees.
Reducing the Velocity Loop Proportional Gain will drop the Open Loop below the Plant vertically and move the Open Loop zero-crossover point toward the desired 100 Hz.
Observe that the Plant defines the limits of the system response. The bandwidth, gain margin and phase margin cannot be pushed beyond those of the Plant without causing instability. |

|
Step 6: Tuning the Closed Loop
|
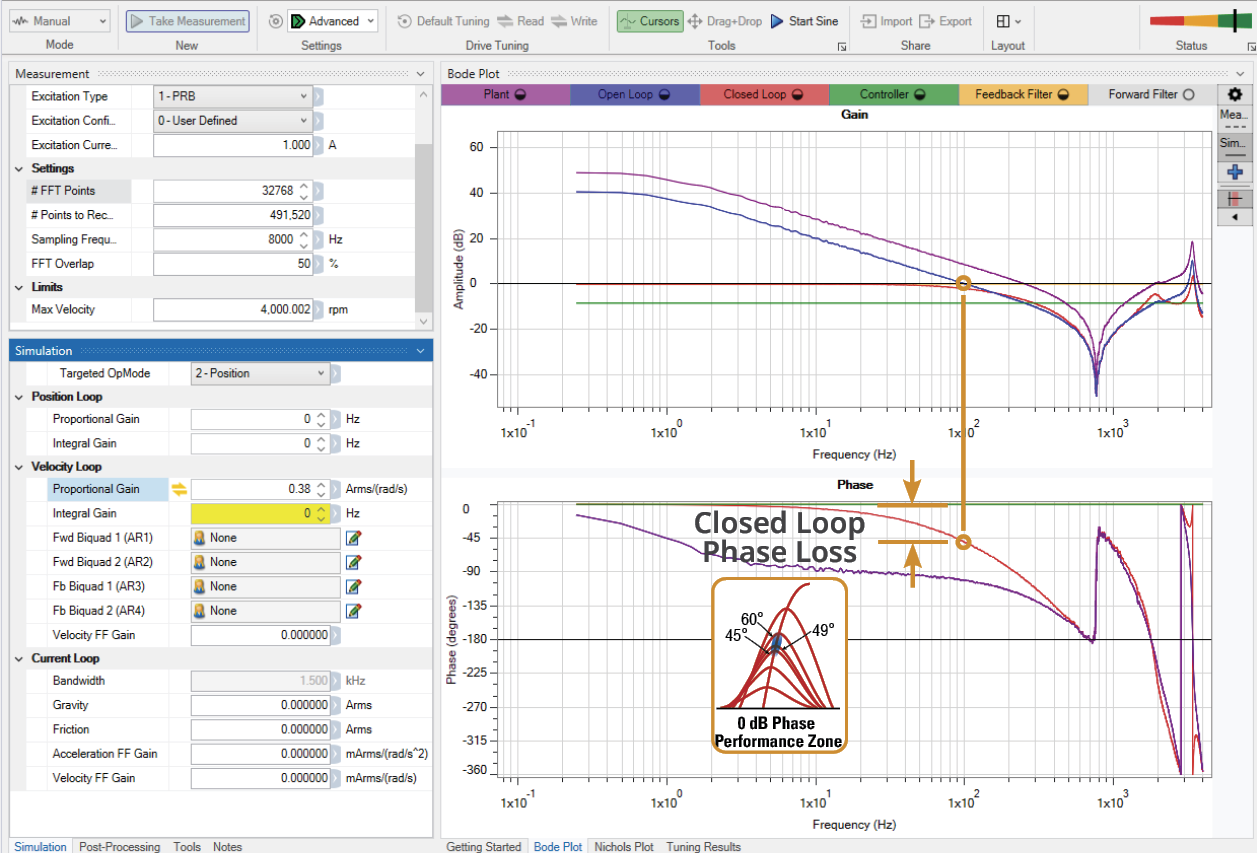
Lowering the Velocity Loop Proportional Gain (VL.KP) to 0.38 brings the brings the Open Loop zero-crossover point to the desired 100 Hz bandwidth.
Observe that reducing VL.KP below 1 (unity) decreased the Controller output from 0 to around -8 dB. Reducing VL.KP also dimished the Closed Loop resonance at 1.8 kHz that was causing instability, while increasing the resonance at 3.3 kHz a few dB above zero.
The Closed Loop phase loss (~50 deg.) falls within the performance zone.
Everything looks good aside from the resonance occurring around 3.3 kHz. Applying a filter will push it down below 0 dB and quiet any noise or instability. |

0 dB Crossover Phase Performance Zone |
Step 7: Using a Filter to Quiet a Resonance
|
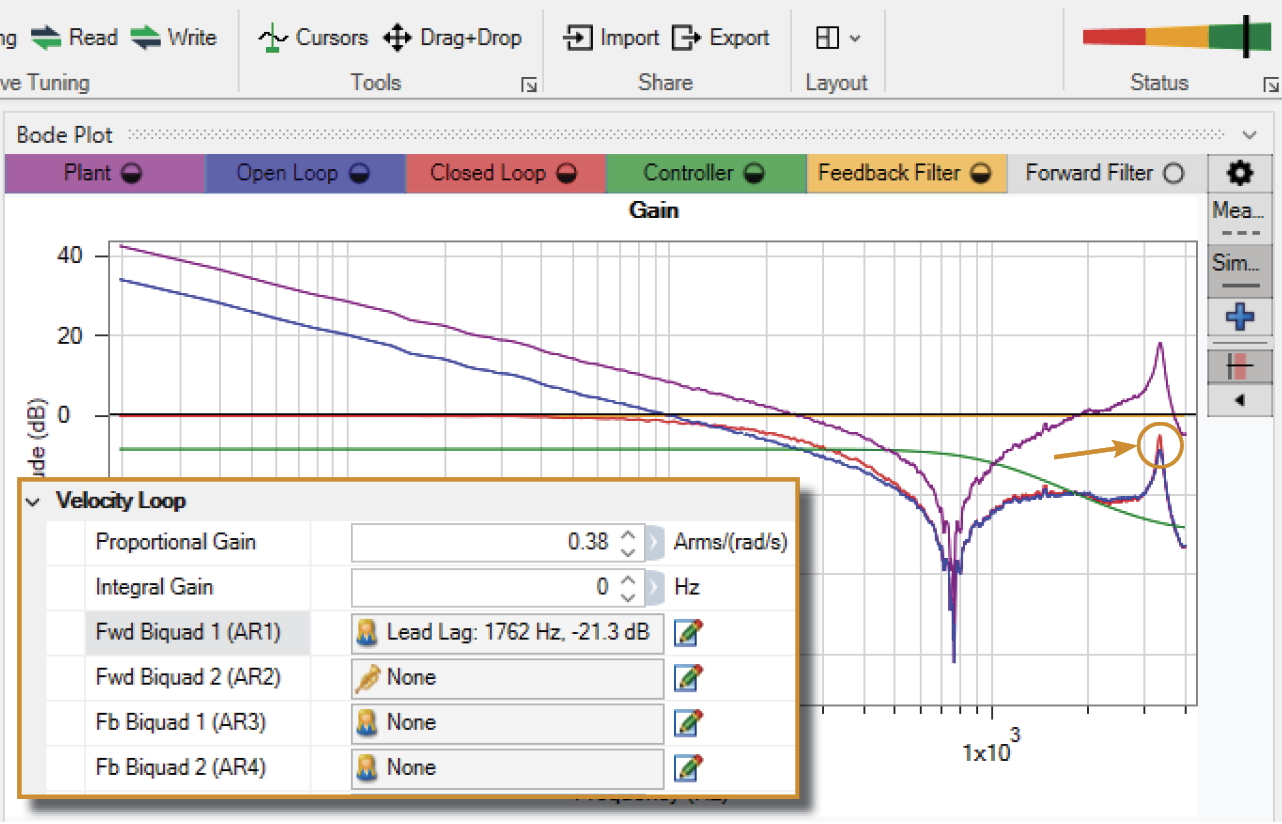
Applying a Lead Lag filter using the settings shown drops the resonance well below 0 dB with no effect on the achieved bandwidth or closed loop phase lag.
This system is now tuned to meet the desired bandwidth performance requirement and operate with less noise. |

|
Step 8: Understand the Impact of Each Gain and Filter on the Response
The above example focused on a simple motor-disk system, which only required minimal adjustments to tune the response.
Most system are complex and will require adjusting multiple gains and filters to achieve the desired performance.
The best way to tune effectively is to use the Simulation mode along with the Drag+Drop Manual Tuning Tool. The Drag+Drop tool allows the gains and filters to be adjusted visually and shape the response to the desired state. Visually adjusting the gains and filters shows how each affects the response and where along the frequency range they are best utilized. Also, note the same filter option (Lead-lag, Low Pass, Resonator (Notch), and Custom (BiQuad)) will have a different effect on the response depending on if it is used as a feedback filter (Fb) or forward filter (Fwd).


