Manual Tuning
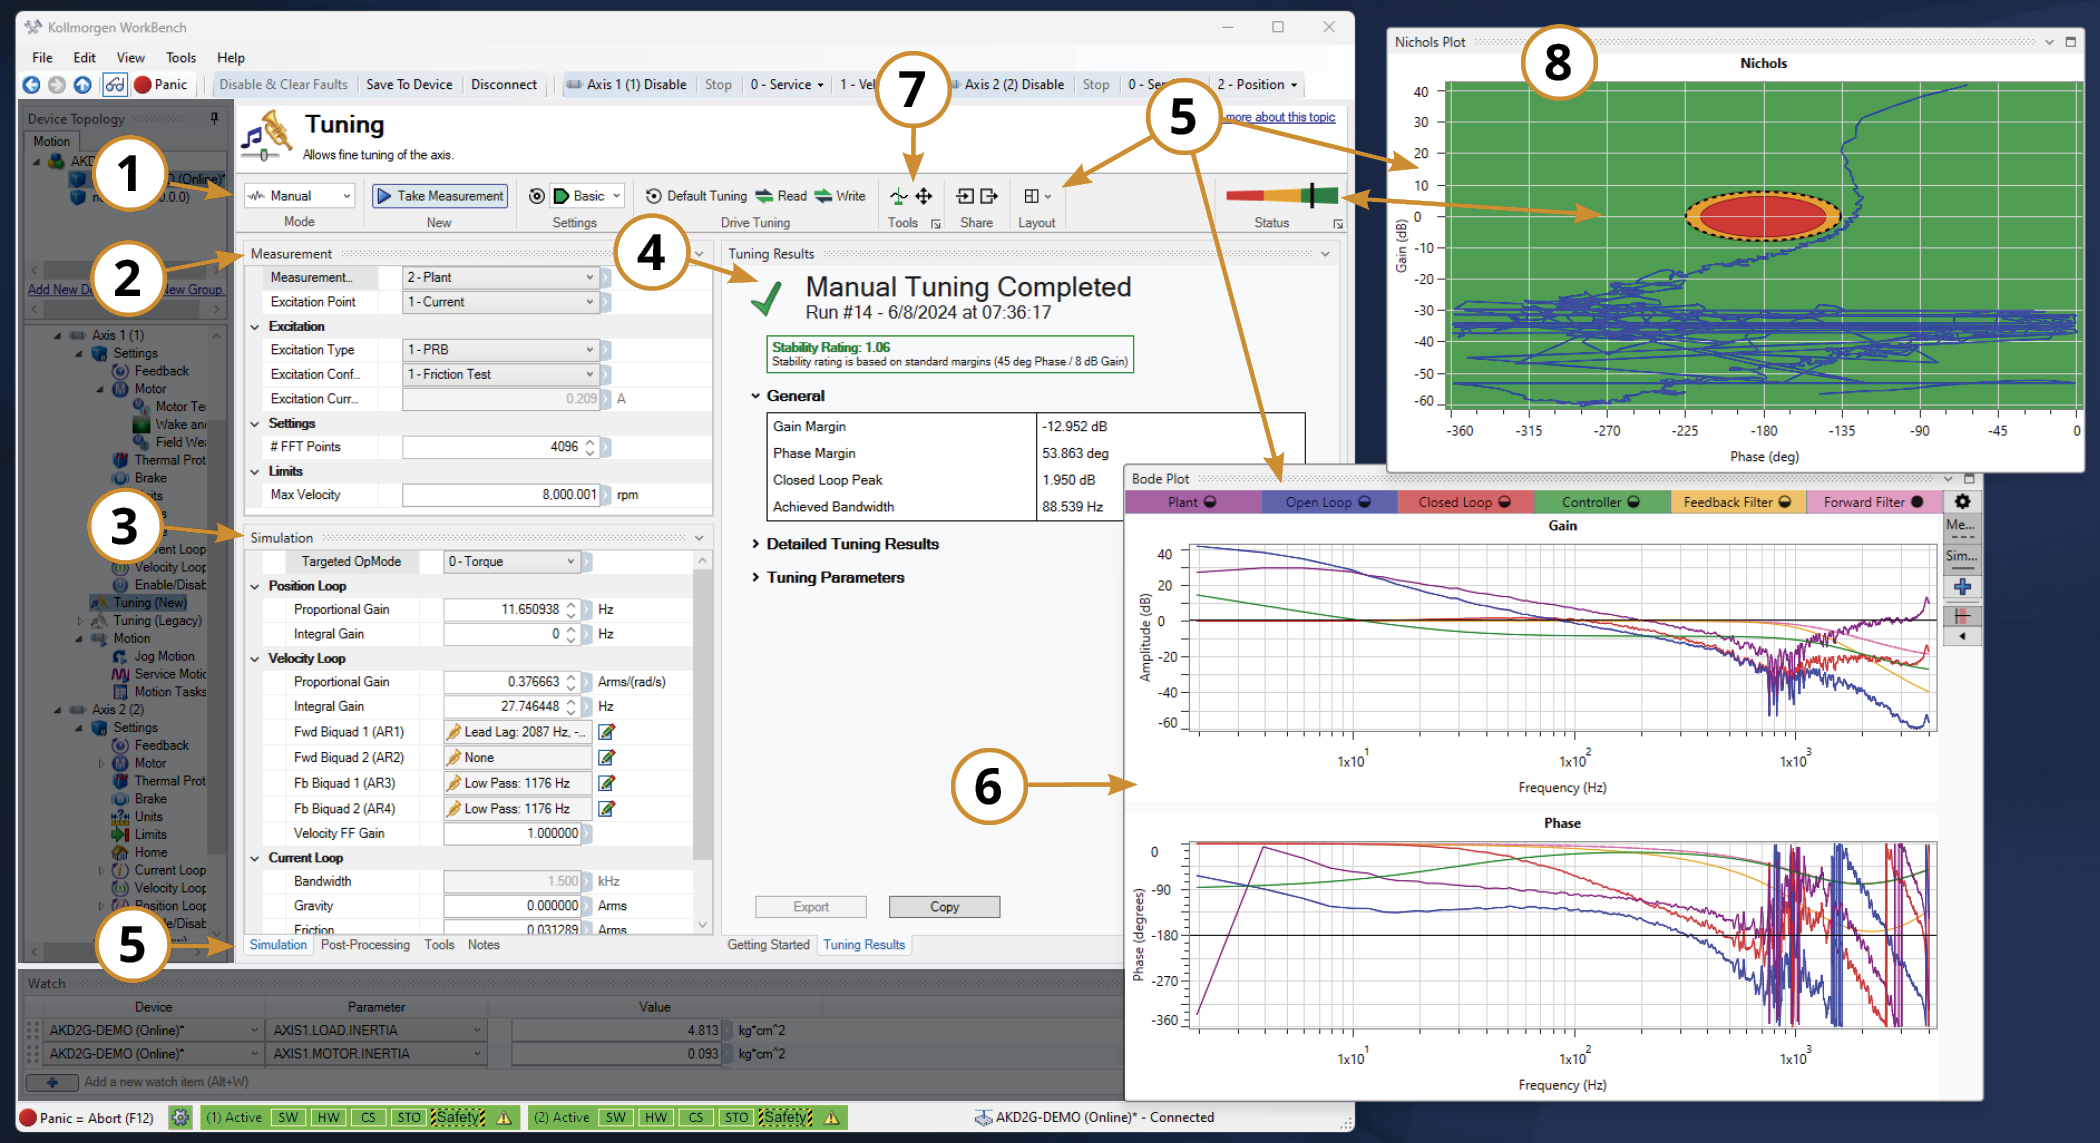
This section covers the user interface for manual tuning in the WorkBench Tuning pane.
Manual Tuning Interface
|
|
Top Ribbon
|
|
||
|---|---|---|
| Parameter | Description | |
|
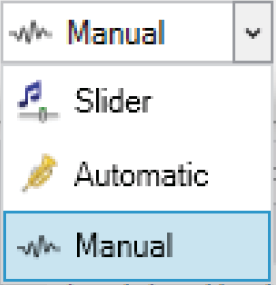
Mode |
Sets the tuning method. |
|
|
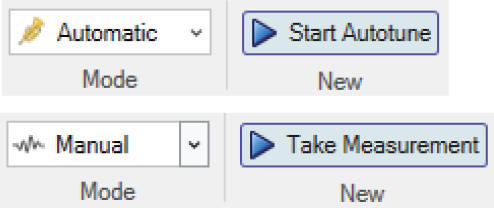
New |
Takes a measurement of the system using the parameters values currently present on the drive. Parameter values set in the simulation pane will not be used unless they are first written to the drive. |
|
|
Settings |
Populates the Settings pane with Basic or Advanced parameters. The Basic setting limits the Measurement Type to Plant and Closed Loop and limits the Settings to only #FFT Points. The Advanced settings adds Current Loop and Custom to the Measurement Type options, as well as additional FFT values to the Settings options. Default Settings: Restores measurement and post-processing parameters to their default values |
|
|
Default Tuning |
Resets the tuning parameters to their defaults at 75 Hz bandwidth. |
|
|
Read |
Reads the current tuning parameters from the drive. |
|
|
Write |
Writes the parameters to the drive. |
|
|
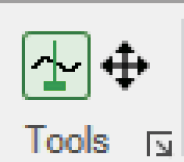
Tools |
Enables/disables cursors, Drag-and-Drop tuning mode on the Bode Plot, and open the Cursor Tools pane. |
|
|
Share |
Import or export CSV files of the tuning data and parameters. |
|
|
Layout |
Changes the structure of the tuning window and panes. Default returns the panes the original layout settings. |
|
|
Status |
Shows the stability rating of the measured or simulated parameters. It is tied to the Tuning Results pane and Bode Plot pane. |
|
Measurement Pane

| Parameter | Options | Description |
|---|---|---|
|
Measurement Type |
1 - Closed Loop |
Measures the response with the control loop included |
|
2 - Plant |
Measures the response of the physical system - without the control loop |
|
|
3 - Current Loop |
Measures the current loop response |
|
|
4 - Custom |
Measures the response based on custom measurement input and output |
|
|
Excitation Point |
1 - Current |
Injection point of the Noise or Sine Excitation between the Controller and the Plant |
|
2 - Velocity |
Injection point of the Noise or Sine Excitation before the Controller |
|
|
Excitation Type |
1 - PRB |
Psuedo random binary signal |
|
2 - Sine |
Sine sweep signal that requires a start frequency, end frequency and step size |
|
|
3 - Noise |
Psuedo random noise signal |
|
|
Excitation Configuration Mode |
0 - User Defined |
User sets the Excitation Current |
|
1 - Friction Test |
Minimum current required to command continuous motion becomes the excitation current |
|
|
Excitation Current |
Current apply to excite the system |
User defined, or determined from Friction Test |
|
# FFT Points |
Default: 4096 Range: 1024 to 32768 |
FFT Resolution to use to generate a Bode Plot from measured data. |
|
# Points to Record |
Determined by the #FFT Points chosen by default |
Total number of sampled data points |
|
Sampling Frequency |
Default 8000 |
Rate at which the points are sampled |
|
FFT Overlap |
Percentage |
Percentage of overlap of time blocks |
|
Max Velocity |
Sets VLTHRESH to a maximum velocity for the excitation tests. If the excitation causes the motor to exceed this, a Motor Overspeed fault will be thrown. |
|
Simulation Pane
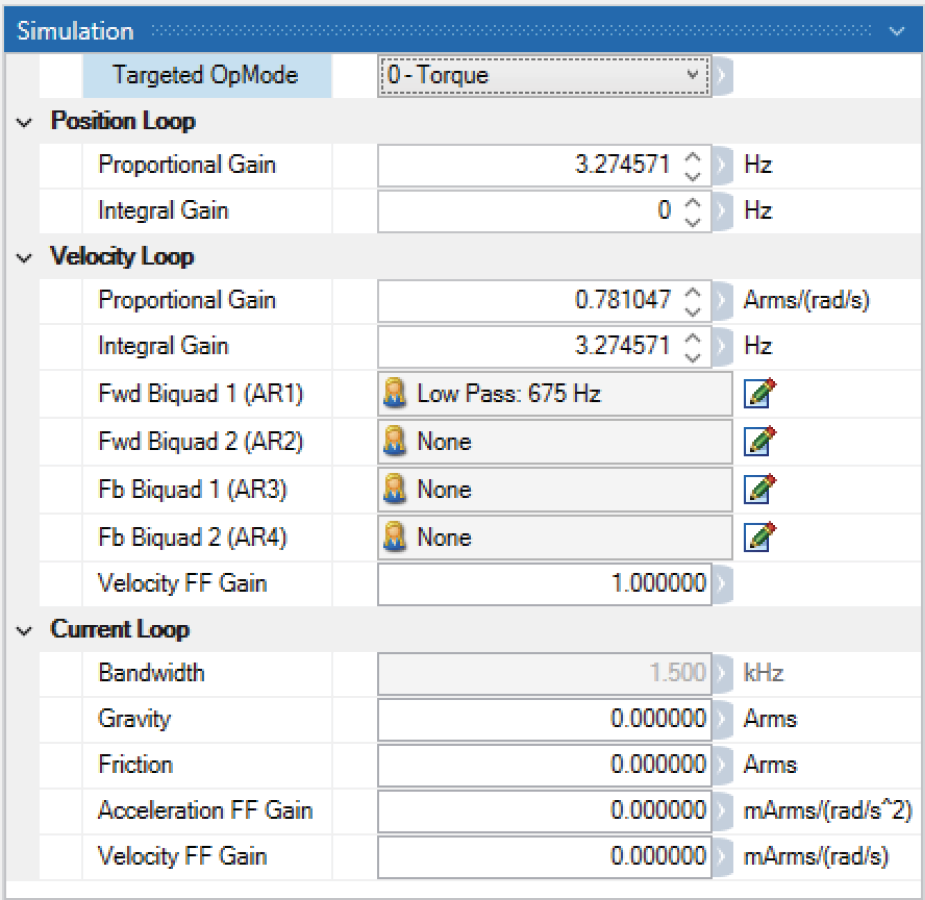
| Parameter | Option | Description |
|---|---|---|
|
Targeted OpMode
|
0 - Torque, 1 - Velocity, 2 - Position |
Used in determining the simulation calculations. The mode of operation the tuned system will utilize. |
|
Position Loop Proportional Gain |
AXISx.PL.KP value |
Proportional Gain in the position control loop |
|
Position Loop Integral Gain |
AXISx.PL.KI value |
Integral gain in the position control loop |
|
Velocity Loop Proportional Gain |
AXISx.VL.KP value |
Proportional gain in the velocity control loop |
|
Velocity Loop Integral Gain |
AXISx.VL.KI value |
Integral gain in the velocity control loop |
|
Fwd Biquad 1 (AR1) |
Low Pass, Lead-Lag, Resonator (Notch), and Custom BiQuad |
Forward Anti-resonance filter 1 |
|
Fwd Biquad 2 (AR2) |
Forward Anti-resonance filter 2 |
|
|
Fb Biquad 3 (AR3) |
Feedback Anti-resonance filter 3 |
|
|
Fb Biquad 4 (AR4) |
Feedback Anti-resonance filter 4 |
|
|
Velocity FF Gain |
VL.KVFF value |
Velocity Feedforward Gain |
|
Current Loop Bandwidth |
IL.BW set to 1.5 kHz |
Current Loop Bandwidth |
|
Gravity |
IL.OFFSET value |
Current required to hold a vertical load in place |
|
Friction |
IL.FRICTION value |
Current required to overcome friction |
|
Acceleration FF Gain |
IL.KACCFF value |
Current loop acceleration feedforward gain |
|
Current Loop Velocity FF Gain |
IL.KVFF value |
Current loop velocity feedforward gain |
Tuning Results Pane
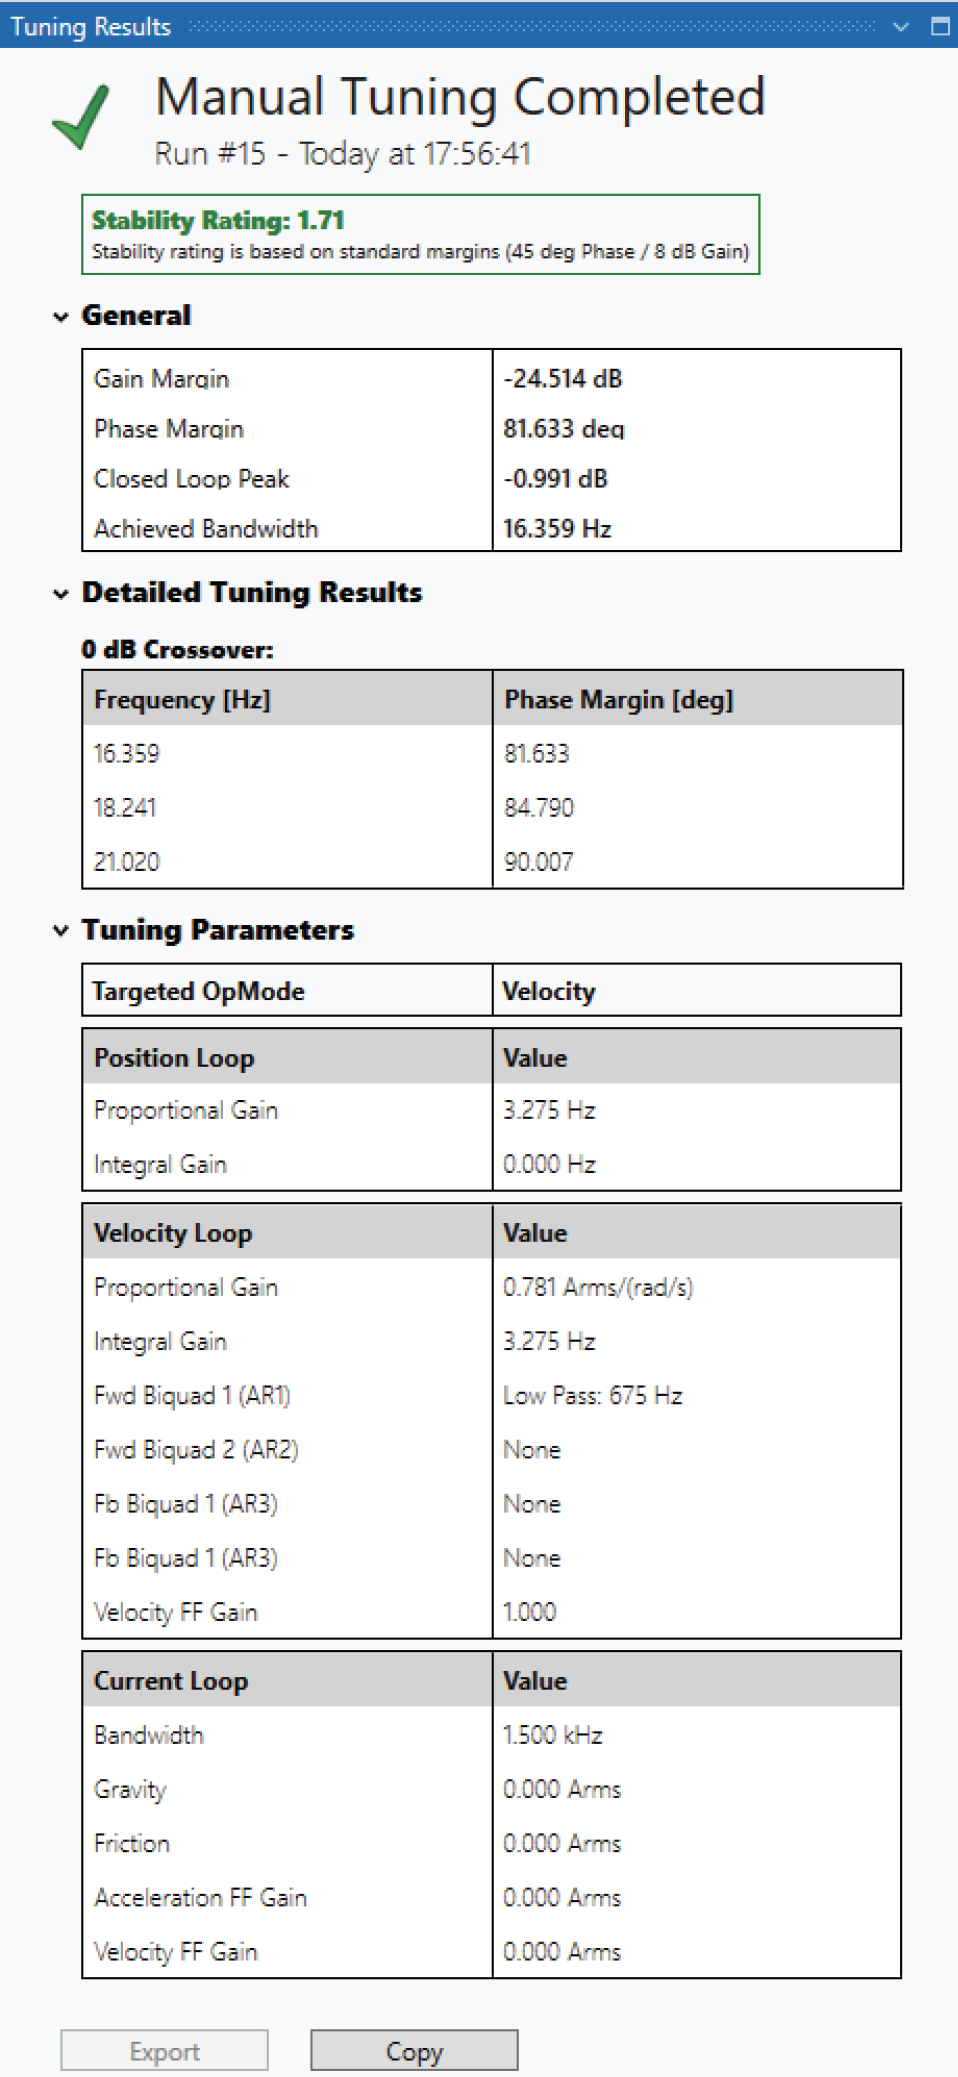
The Tuning Results pane provides the results and parameter values used to achieve them. The data can be copied and pasted into any text editor.
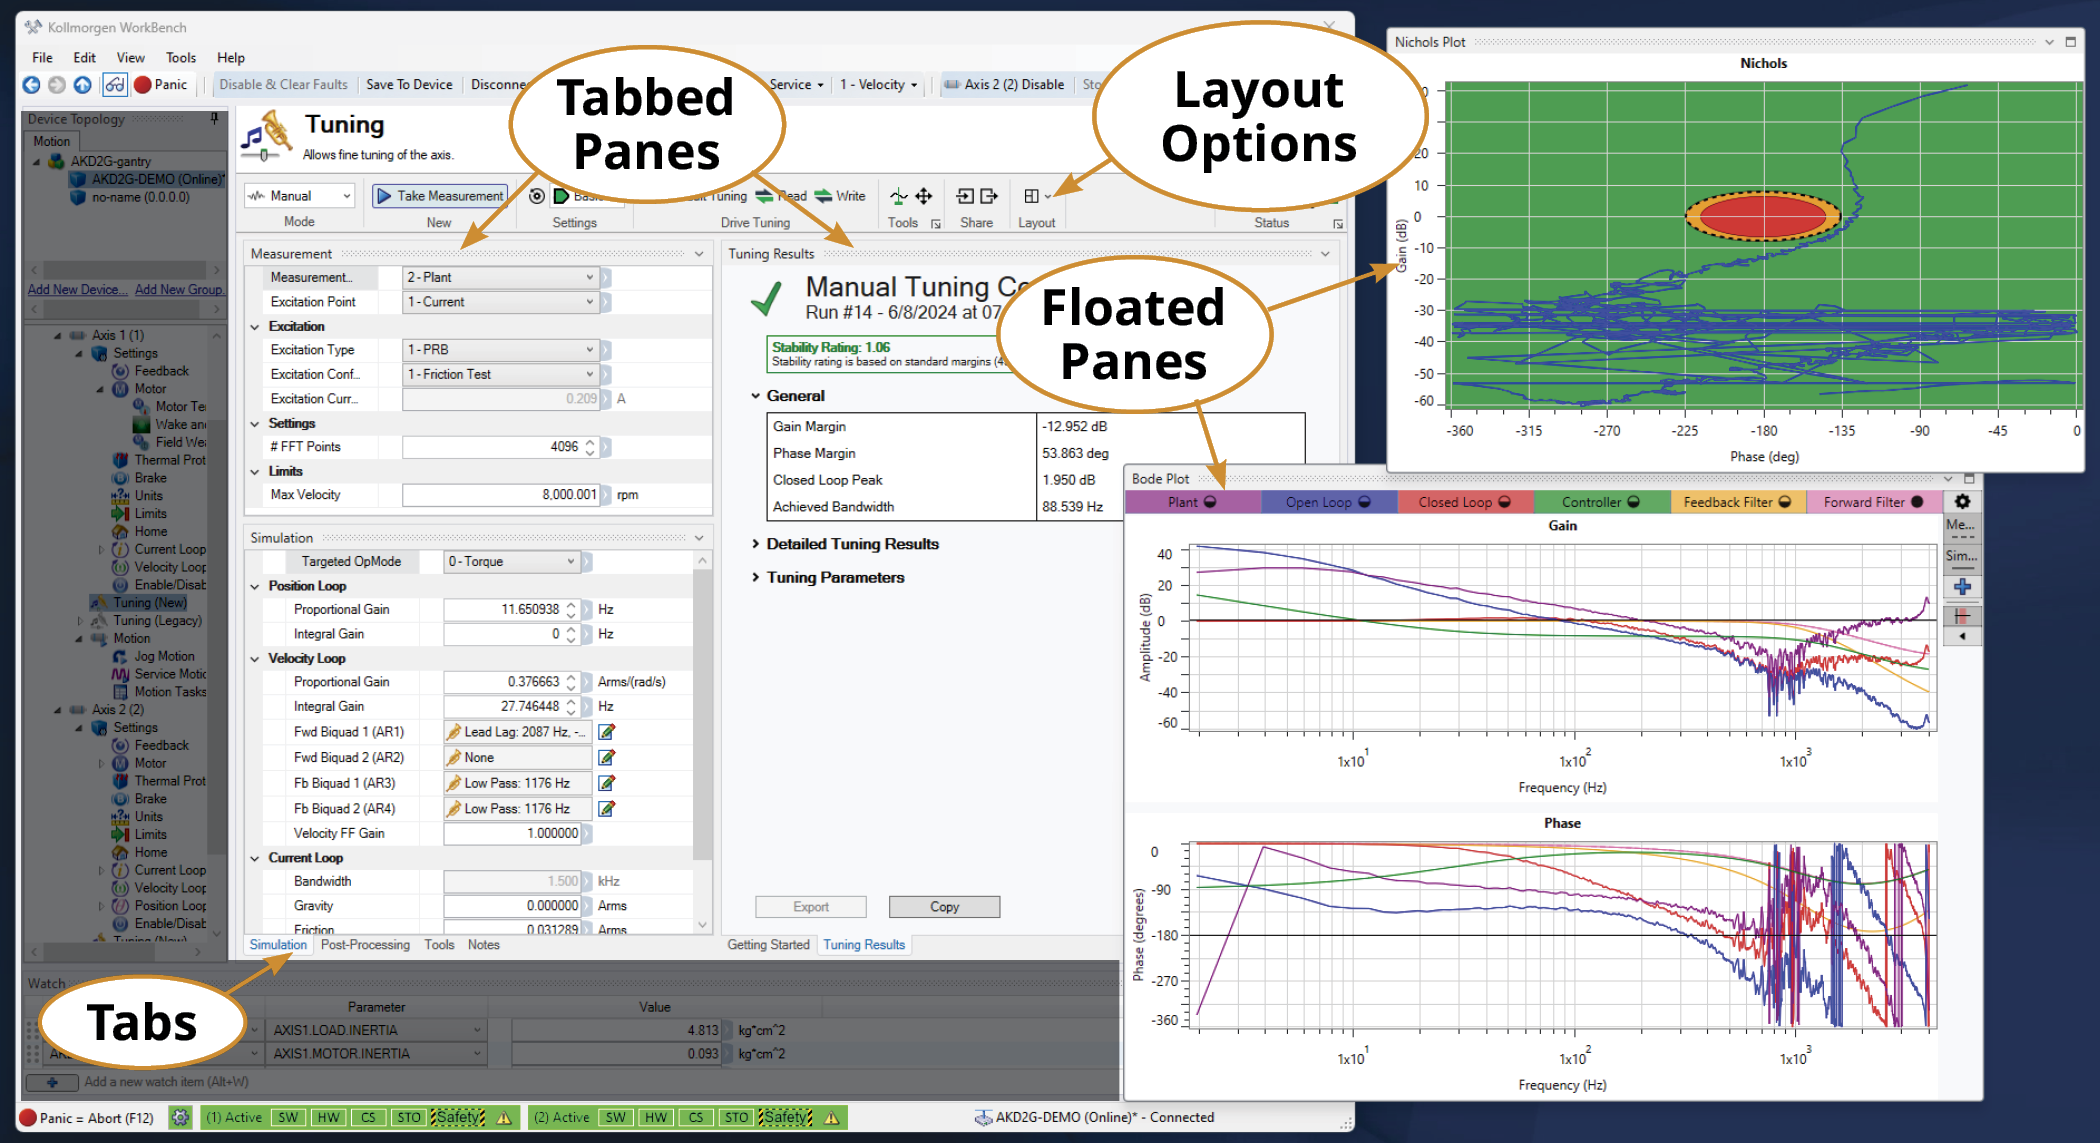
Floating Panes
Any pane within the Tuning view can be moved around or floated outside WorkBench.
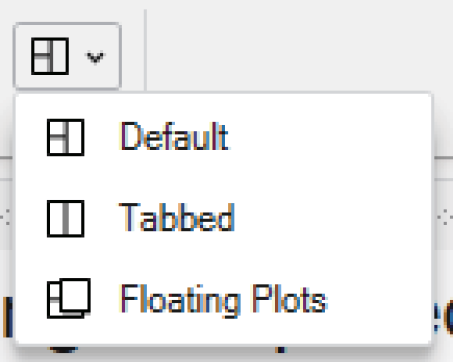
Use the Layout options to organize the panes to the default settings, organize the panes in tabs located across the bottom of the tuning pane, or float the Bode and Nichols Plot panes.
Bode Plot Elements and Tools
|
|
Plots
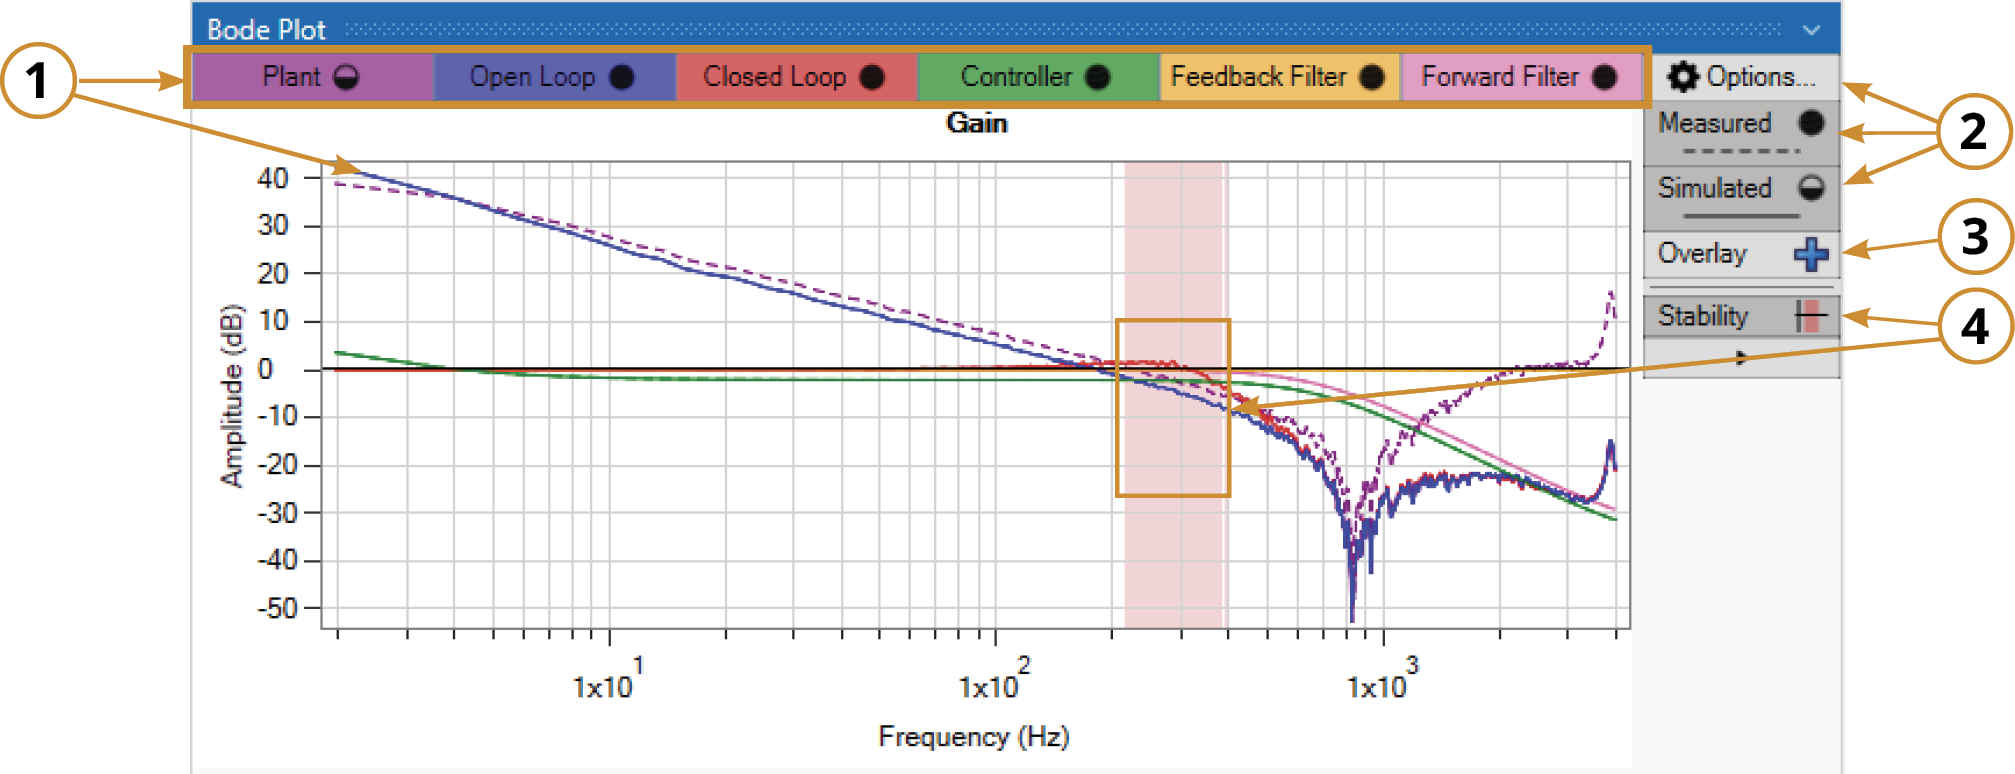
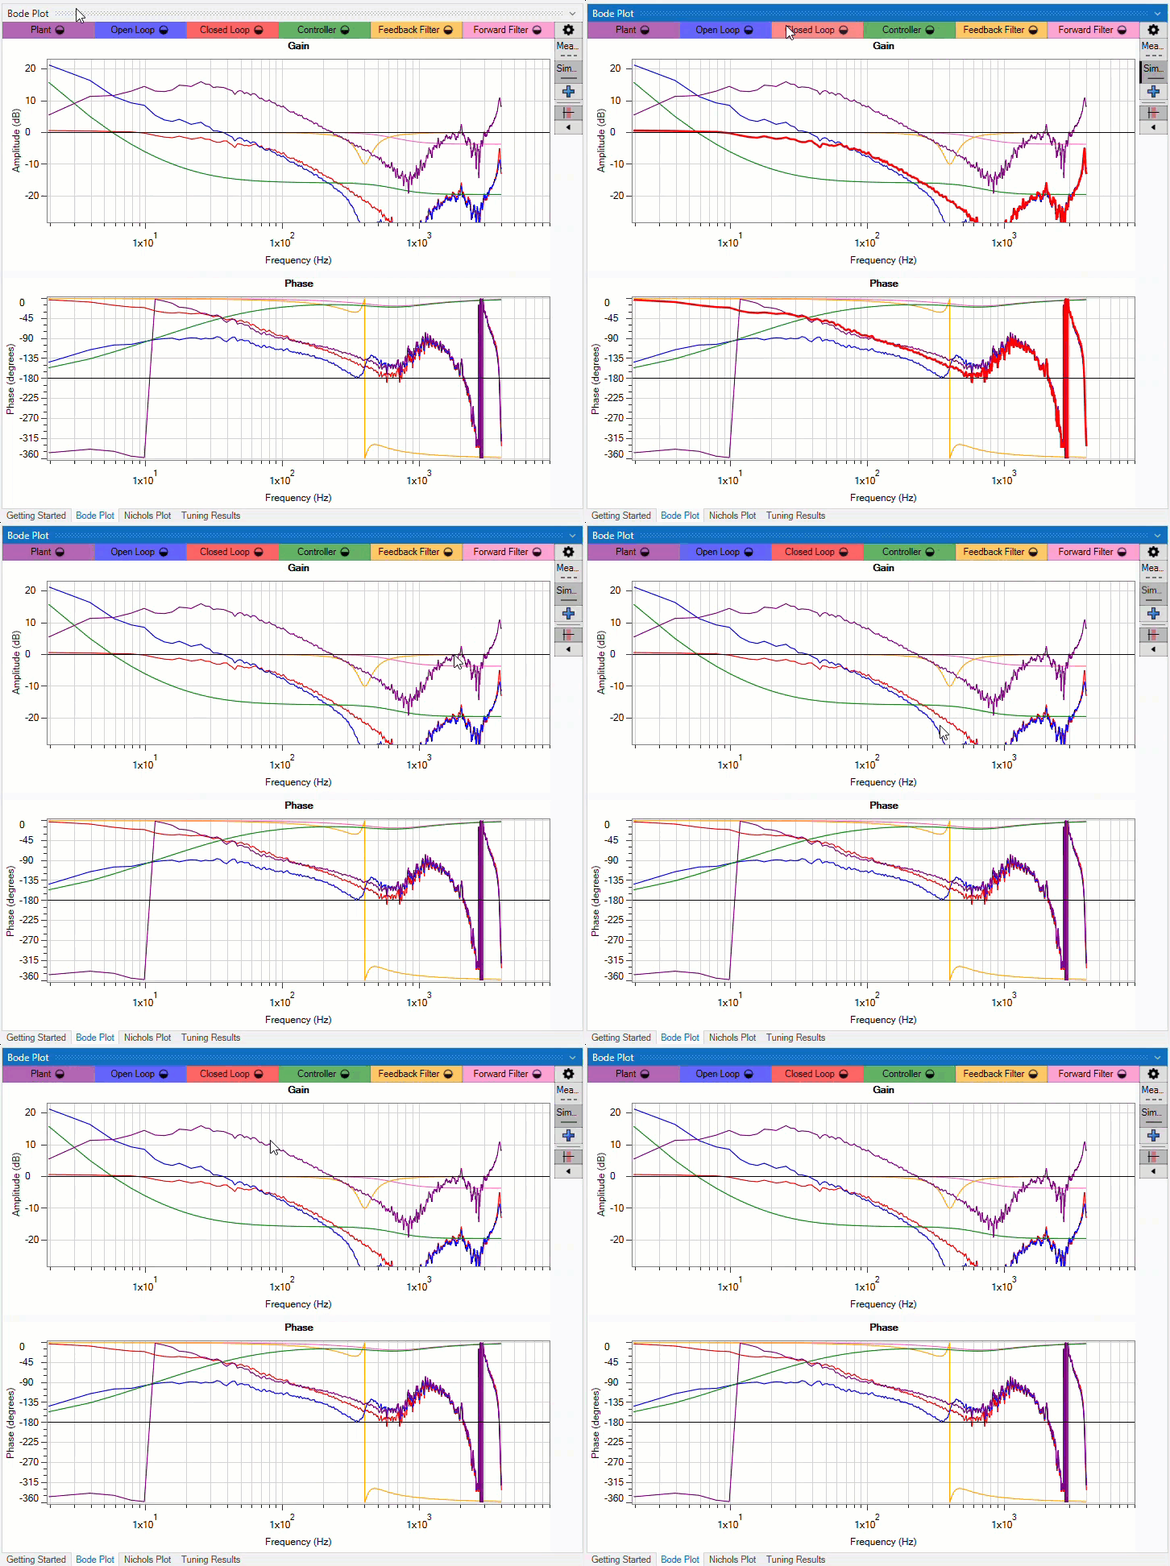
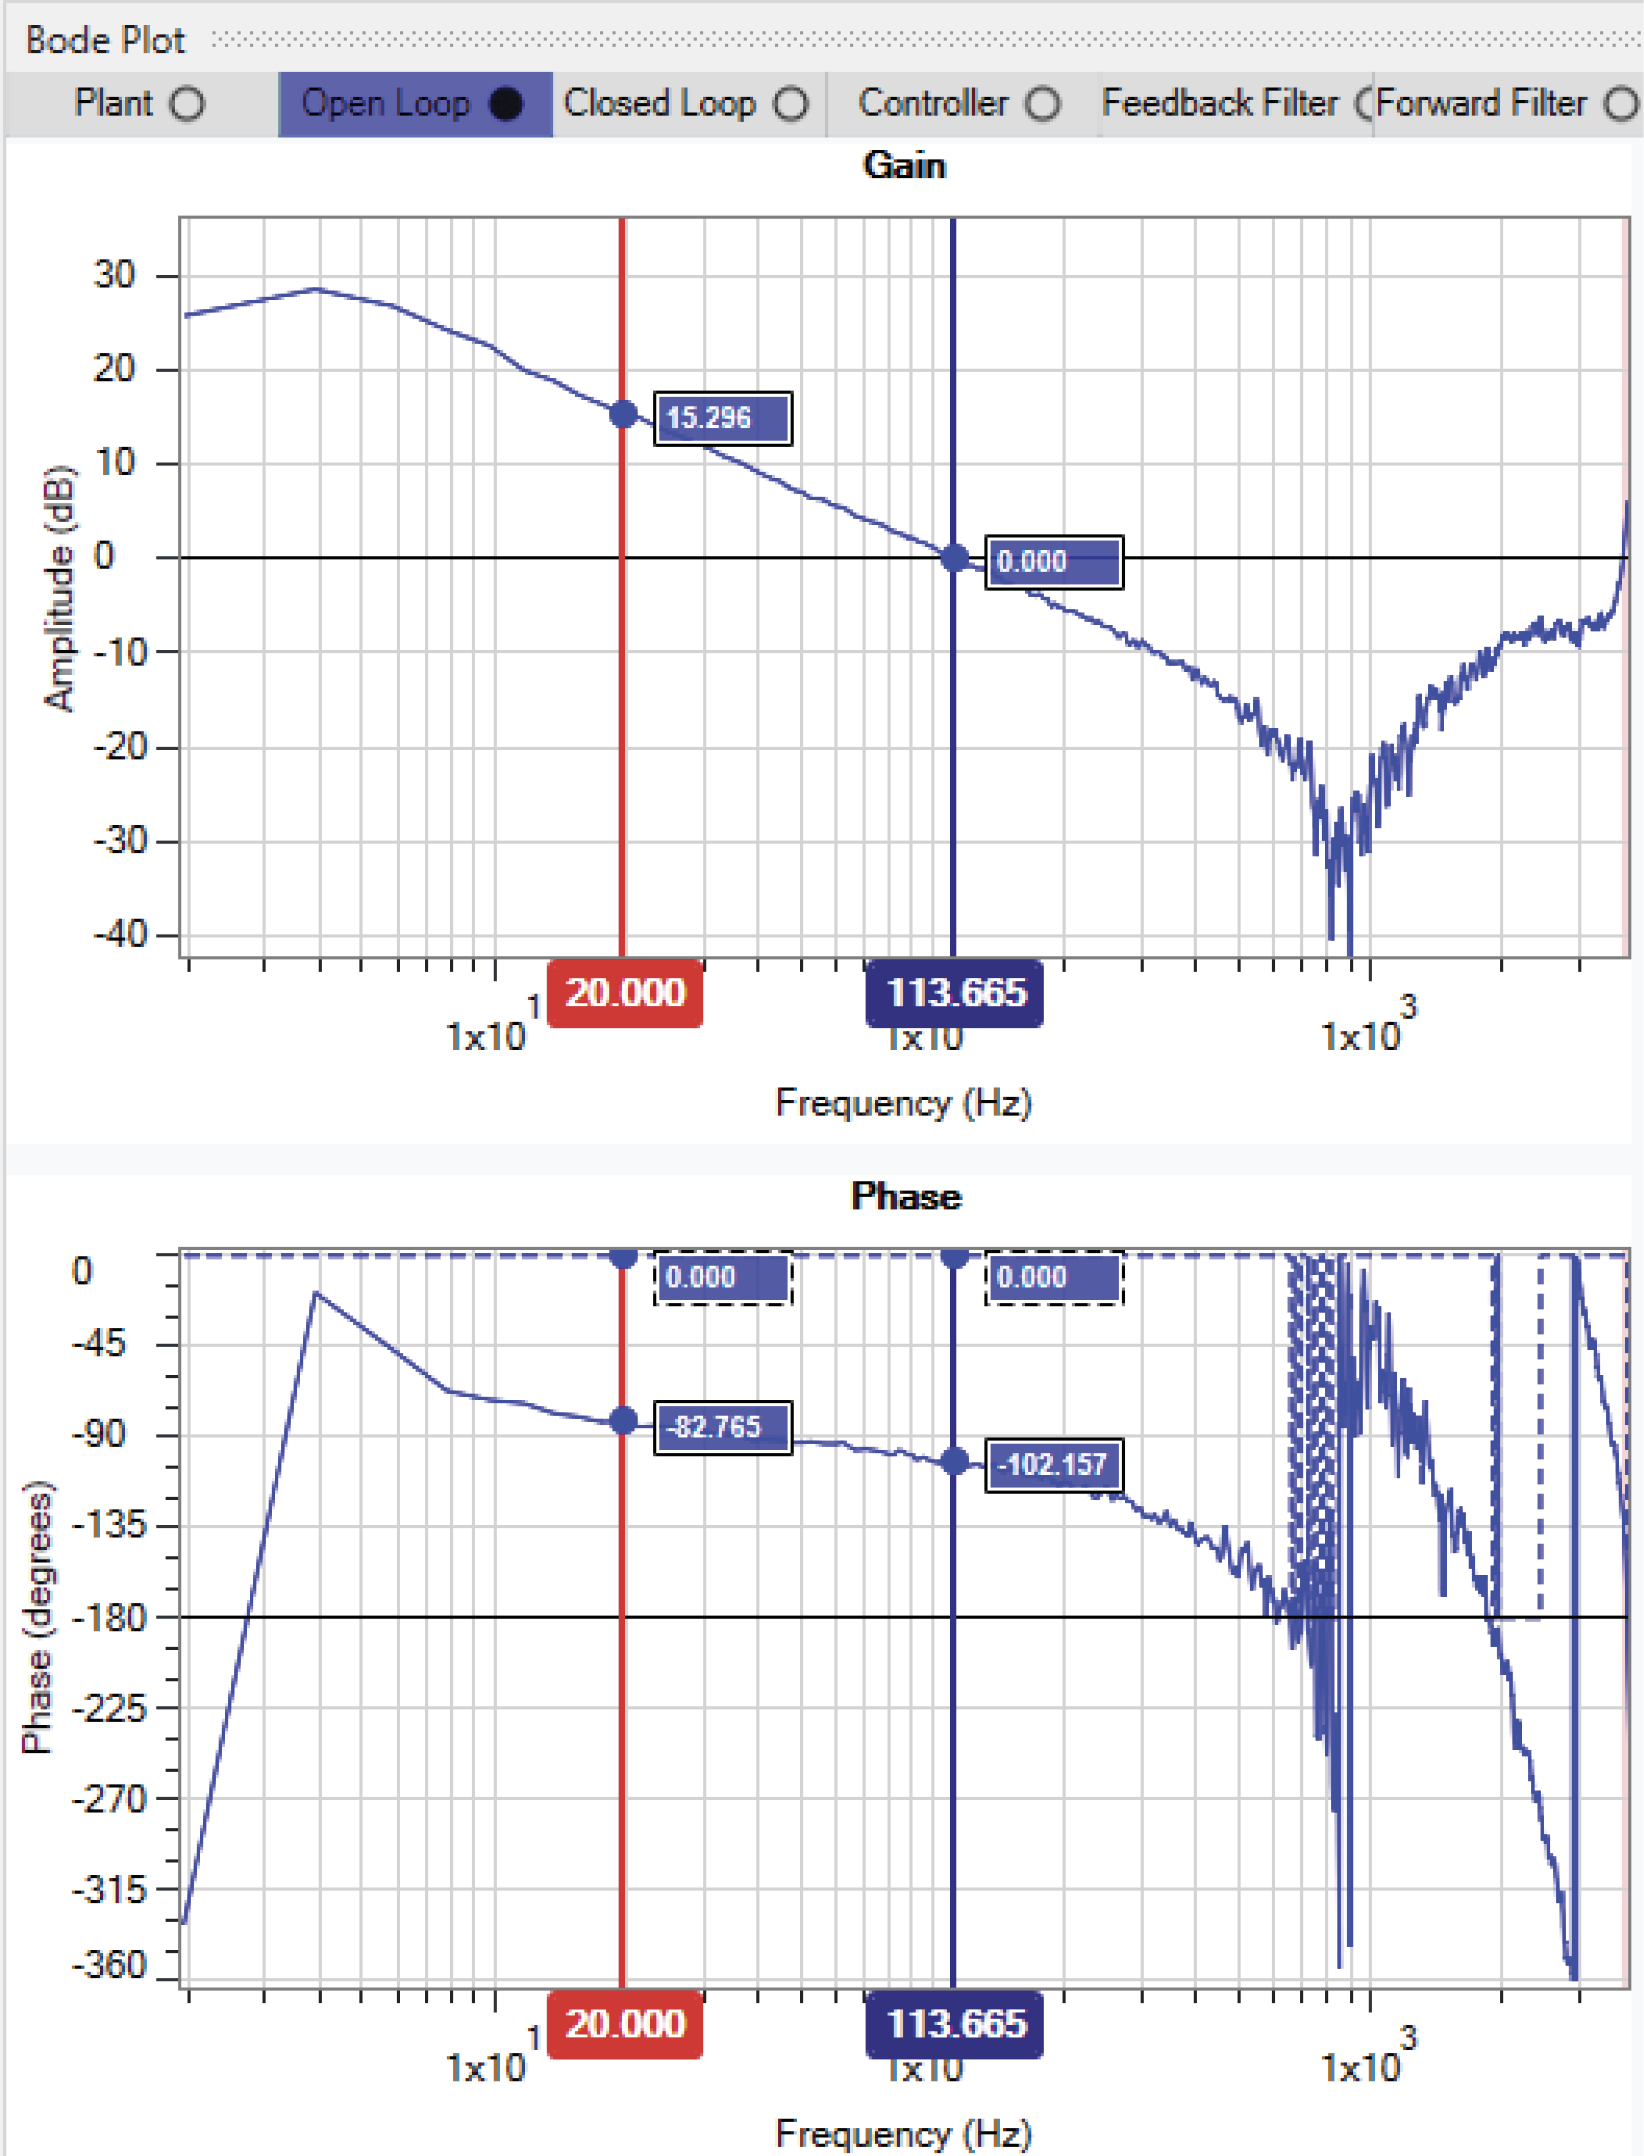
The bar across the top displays the 6 available plot buttons. Hovering the mouse over the plot, or plot button, highlights both. Clicking the plot buttons toggles them on and off.
Plot Options
Clicking the Options button opens the Bode Plot Legend Options pane. You can set the measured and simulated plot shown. Clicking the Measured or Simulated buttons toggles their view.

Overlays
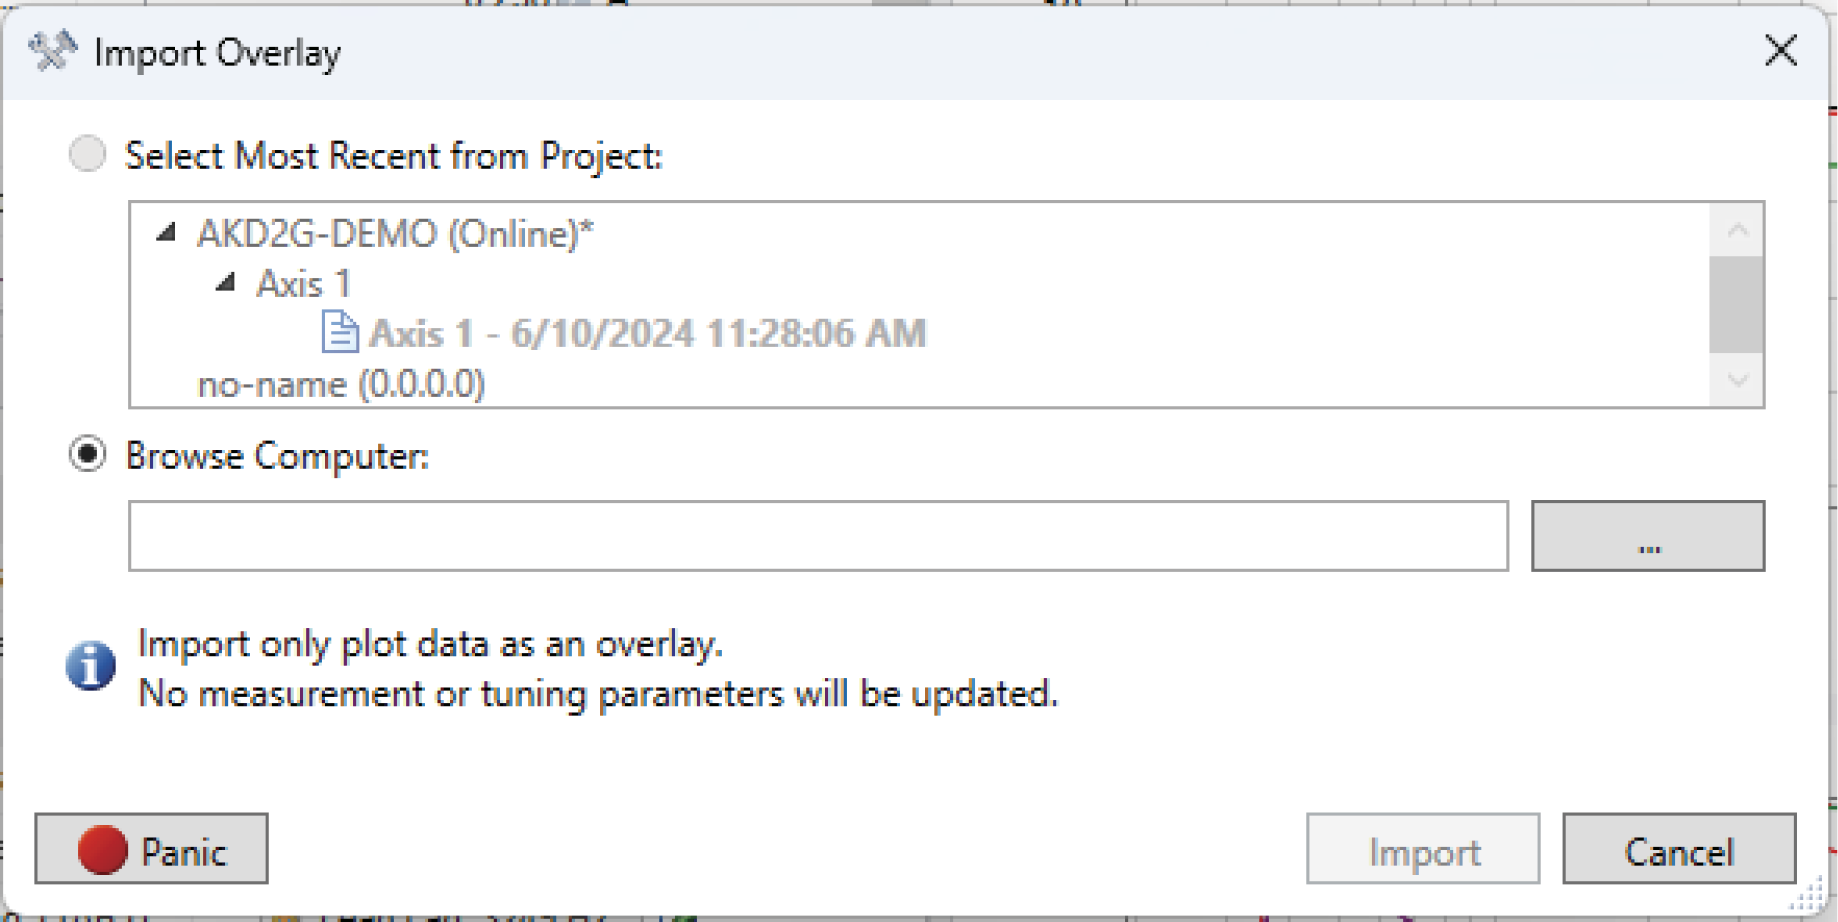
Import overlays (plots) from previous measurements and simulations for comparison.
Stability Status
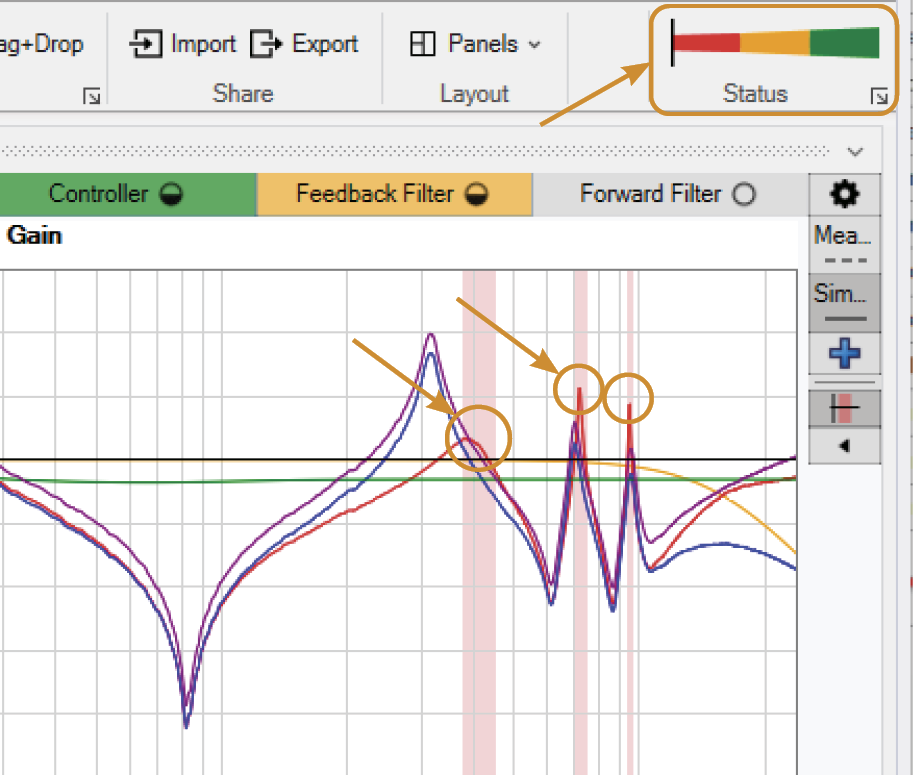
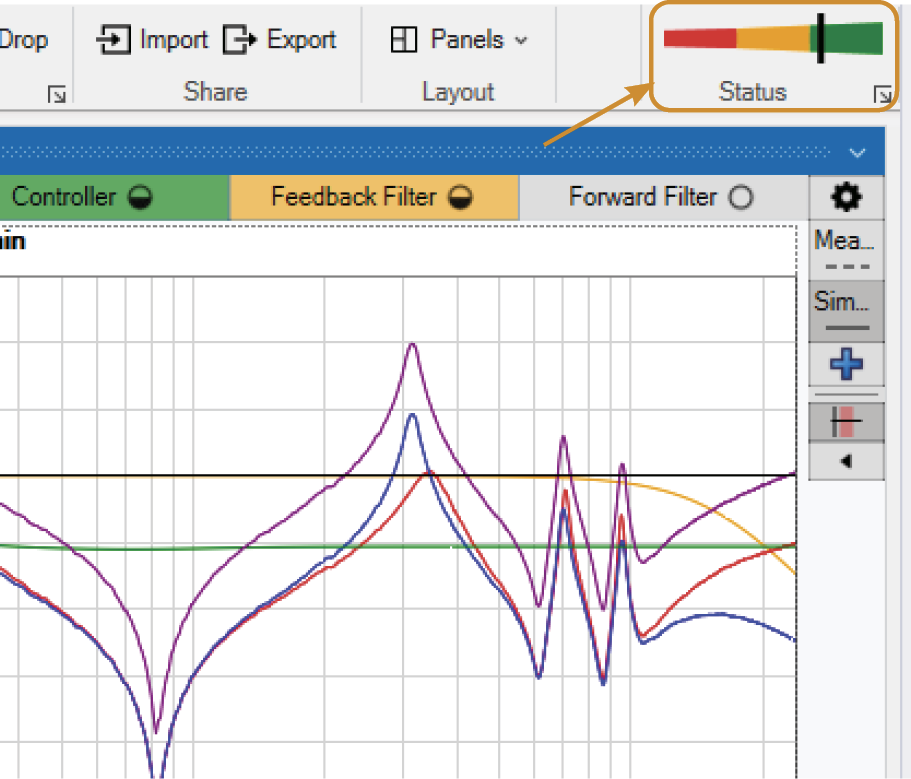
The Status gauge provides a quick visual reference of the system's stability and is in sync with the bode plot.
Bode Plot Tools

The Tools feature provides the ability to add and display cursors to the bode plot, each with or without data labels, visually adjust gains and filters on their plots, and perform Sine sweeps.
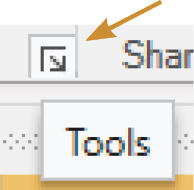
Pressing the button in the bottom right corner of Tools opens the Tools pane. The Tools tab at the bottom of the Tuning view can also open the Tools pane.

Within the Cursor Configuration, cursors can be added, set to a frequency or a specific ccolor, and display the data associated with each cursor.
The Cursor Data displays the data for each cursor and plot.
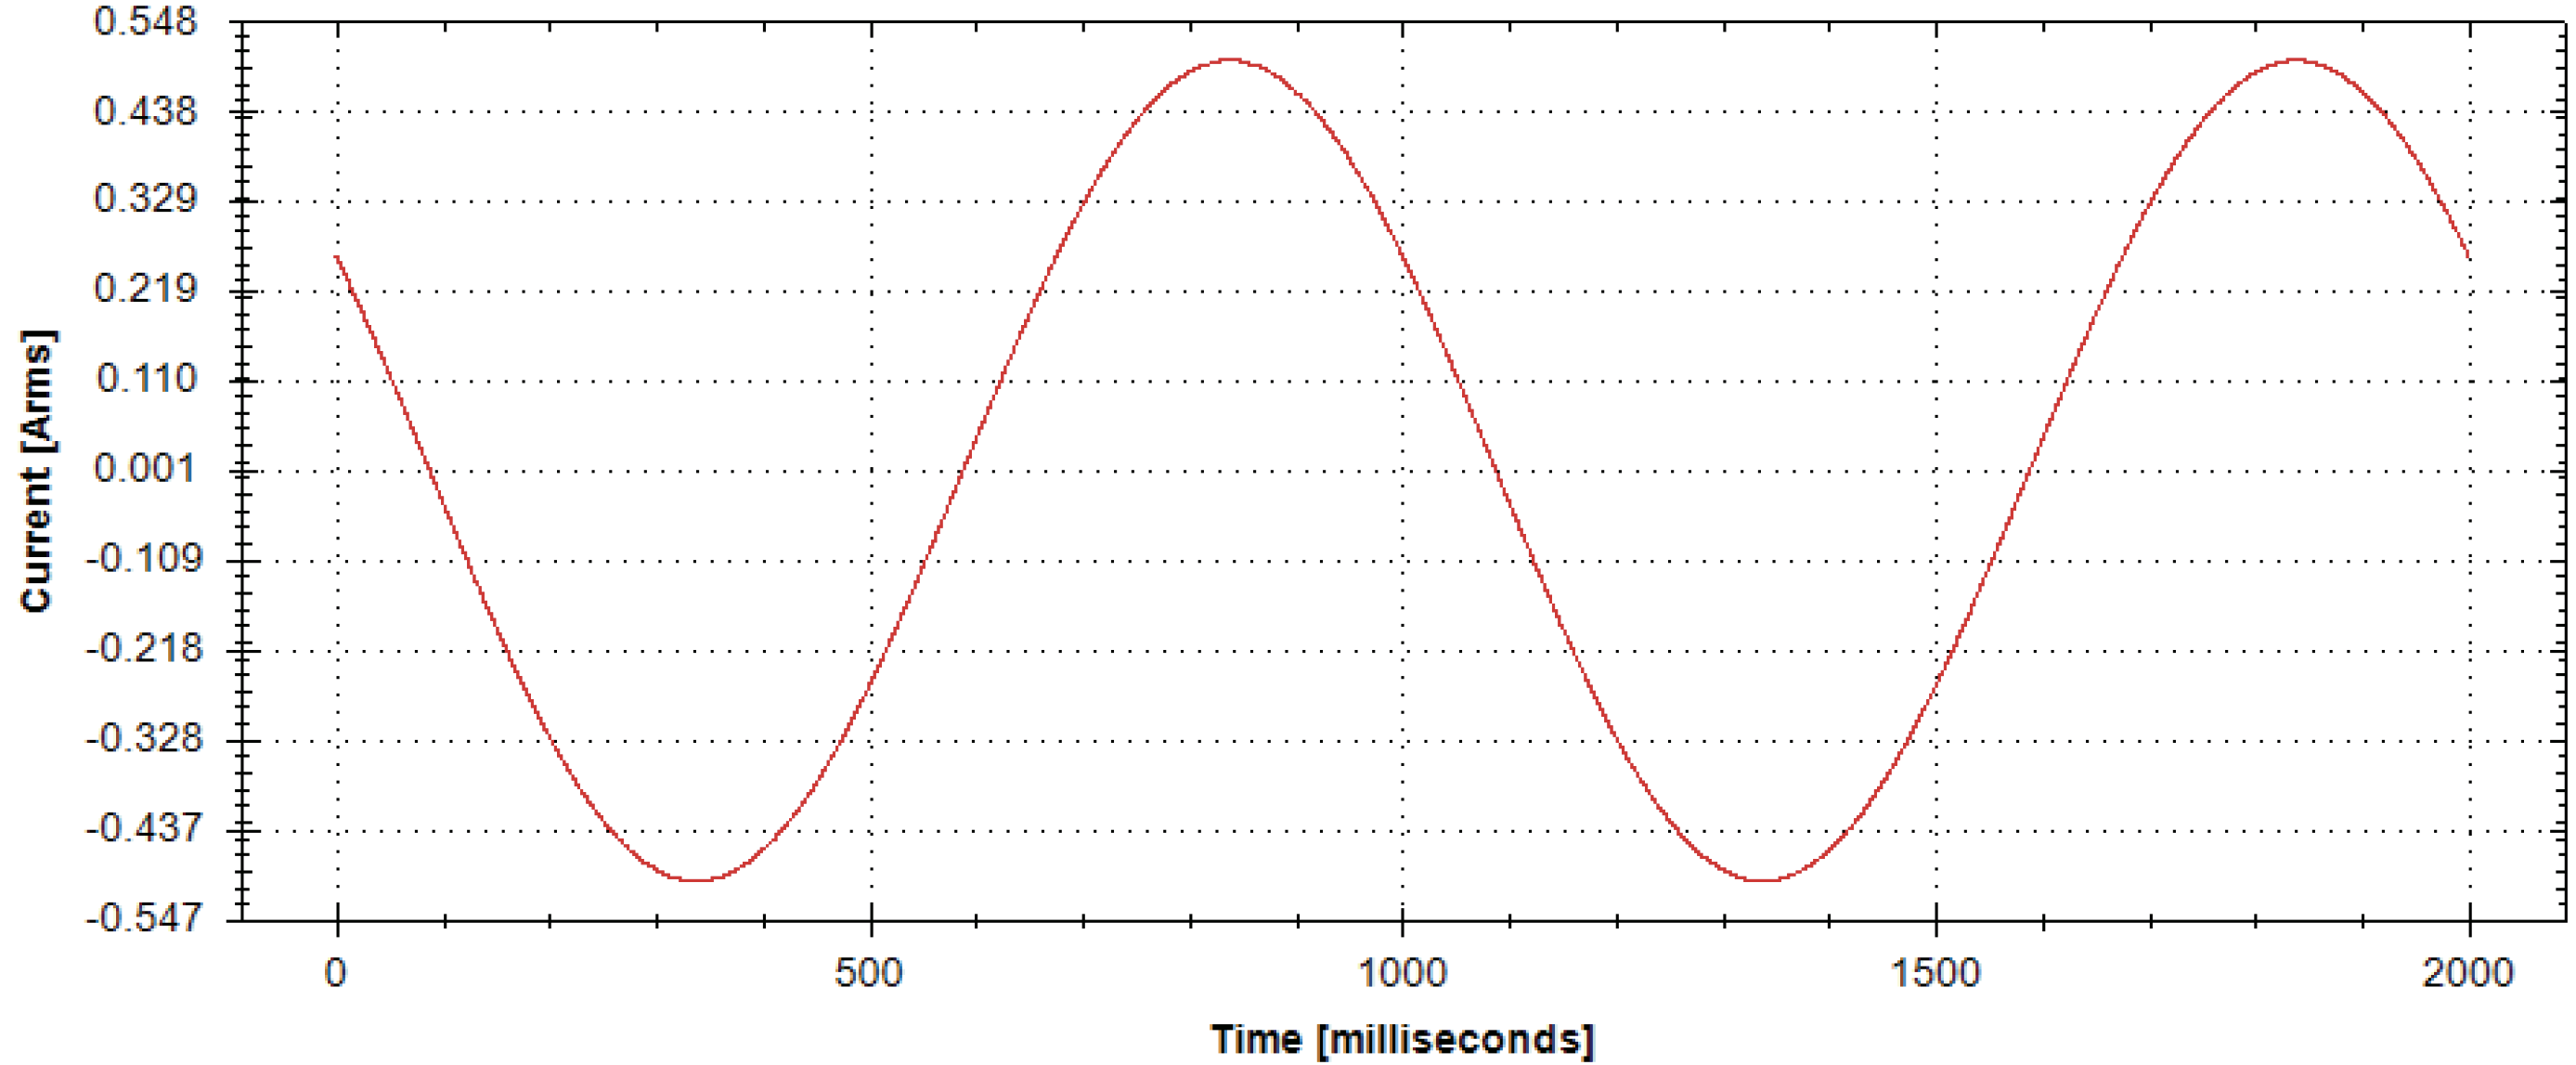
The Sine enables a continuous sine sweep at the set excitation current and frequency.
Nichols Plot
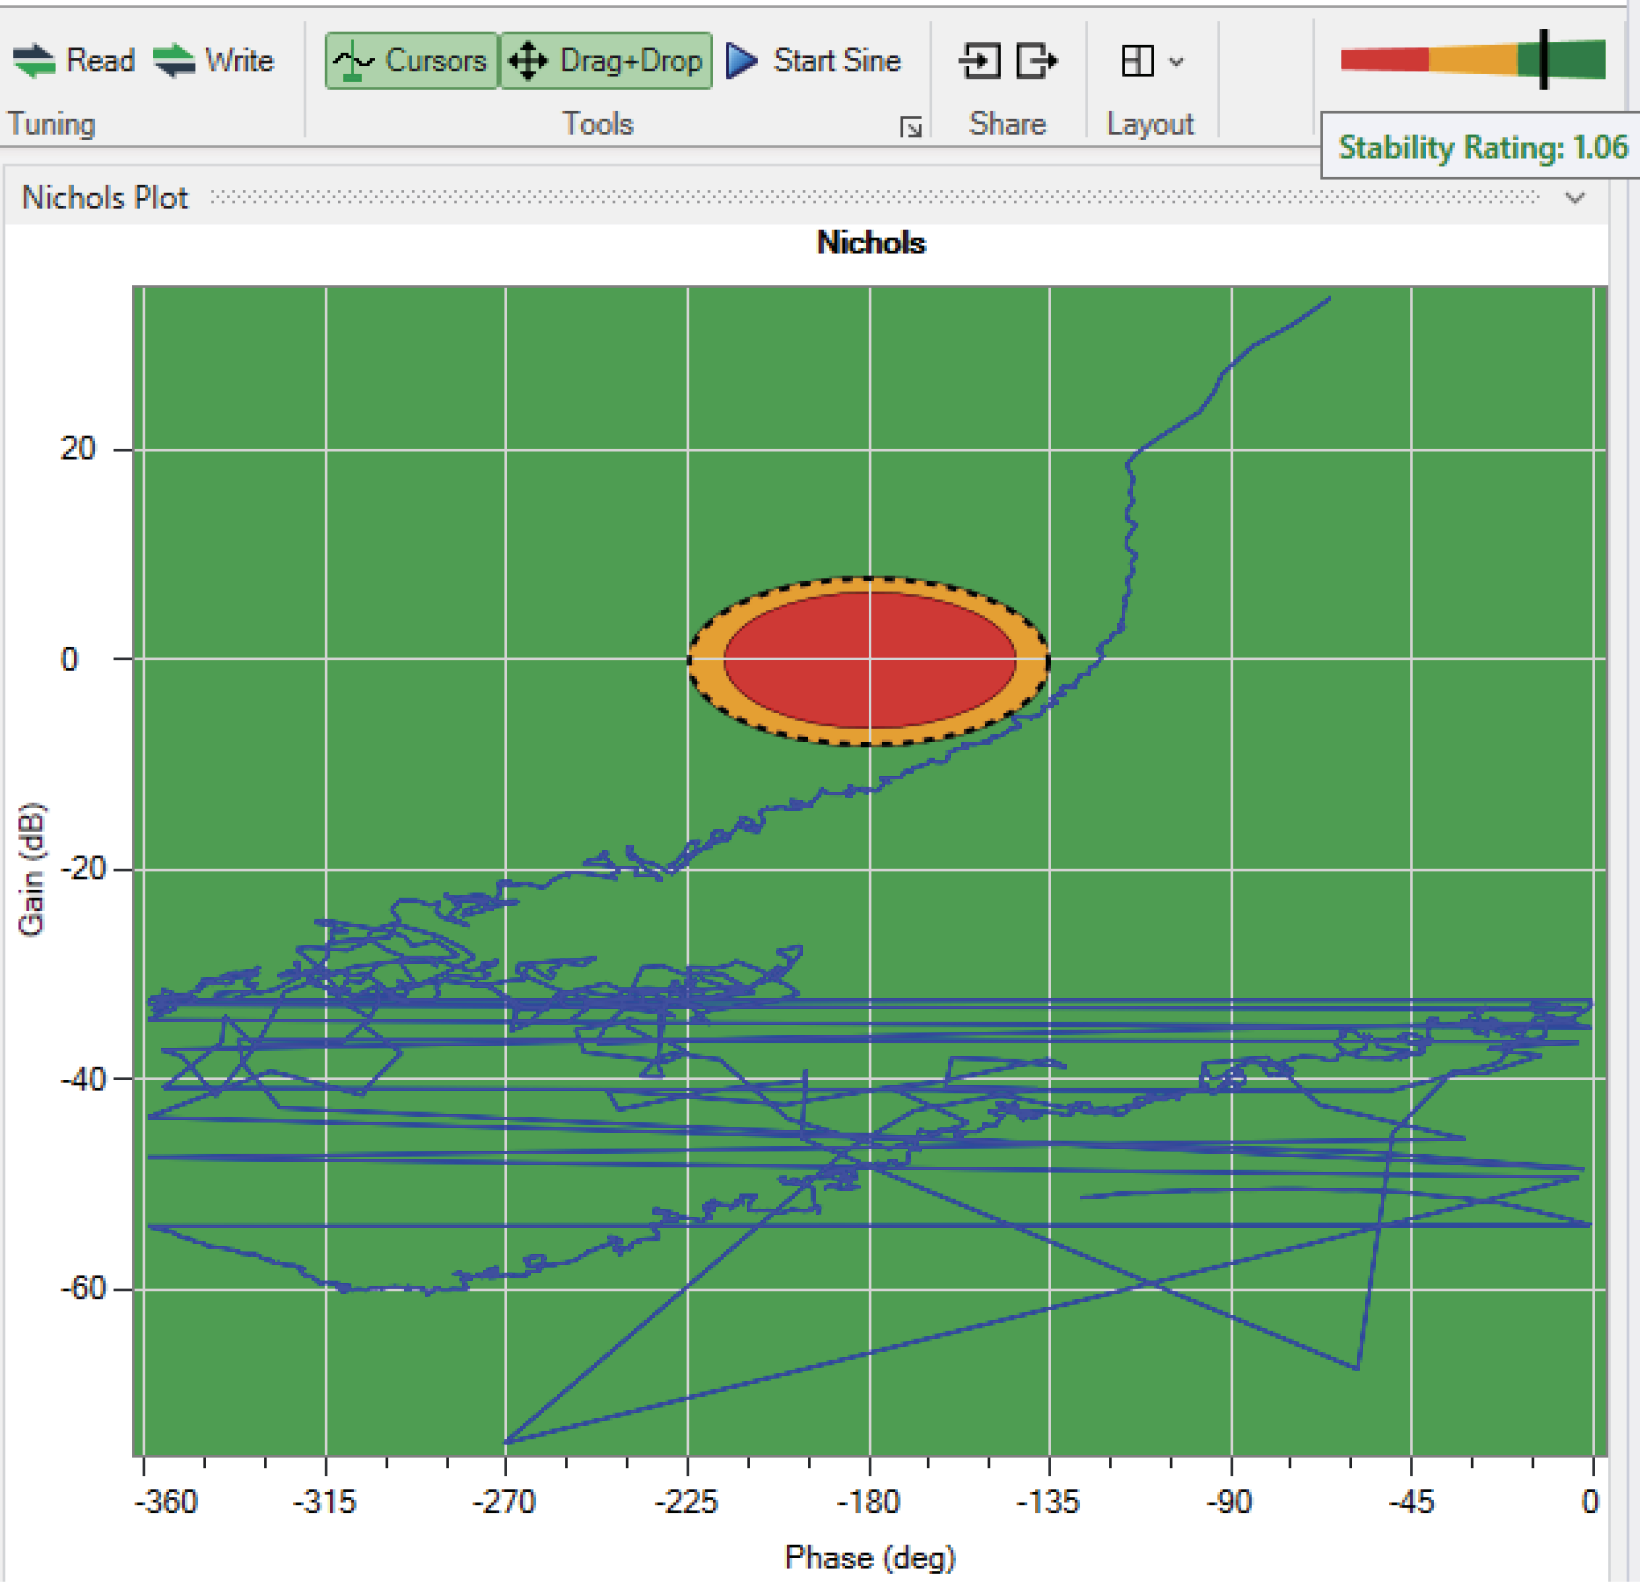
The Nichols Plot provides a 2D visual gain vs. phase representation of the system stability status.
